As I was reviewing notes for my course "Data Simulation for Evaluating Statistical Methods in SAS," I realized that I haven't blogged about simulating categorical data in SAS. This article corrects that oversight.
An Easy Way and a Harder Way
SAS software makes it easy to sample from discrete "named" distributions. For example, the binomial, geometric, negative binomial, and Poisson distributions are all available by calling the RAND function in the DATA step or the RANDGEN subroutine in the SAS/IML language. The challenge comes when you want to sample from a finite set of k elements and the probability of selecting the ith element is pi, where Σi pi = 1.
There is an easy way to do this and a harder way. The harder way is to divide the interval [0,1] into k subintervals of lengths pi, and generate a random uniform variable, u on [0,1]. You choose the ith element when u lands in the ith subinterval.
I used this method for about 10 years before I discovered that there is an easier way: use the "Table distribution." I had often seen the documentation for this distribution, but I assumed it was some obscure statistical distribution that I had never heard of. It never sunk in that this "distribution" was intended to sample categorical data with a known set of sampling probabilities. To be explicit:
The "Table" distribution enables you to specify the sampling probabilities that are associated with each of k events, and to draw randomly from those events.
In the remainder of this article, I show how to use the "Table" distribution to sample from a discrete set of events. For further details, see Chapter 13 (p. 322) of my book, Statistical Programming with SAS/IML Software.
Simulation of Categorical Data by Using the DATA Step
Suppose you have a drawer with ten socks: five black, two brown, and three white. If you draw a sock at random, the probability of choosing a black sock is 0.5, the probability of brown is 0.2, and the probability of white is 0.3. If you replace the sock after each selection, mix them, and draw again, you are randomly sampling with replacement with unequal probability.
You can use the RAND function in the SAS DATA step to simulate this process. The following statements simulate drawing 10,000 items. The results are stored in the SAMPLE data set.
%let NSim = 10000; /** sample this many times **/ data Sample; call streaminit(54321); do i = 1 to &NSim; x = rand("Table", 0.5, 0.2, 0.3); output; end; run; |
Alternatively, it is often convenient to have the vector of probabilities in an array. In this case, you can use the OF operator to pass the arguments of the array to the RAND function. If you do not need the probabilities in the output data set, you can use the _TEMPORARY_ keyword to drop the array variables, as follows:
data Sample; drop i; array prob[3] _temporary_ (0.5, 0.2, 0.3); call streaminit(54321); do i = 1 to &NSim; x = rand("Table", of prob[*]); output; end; run; |
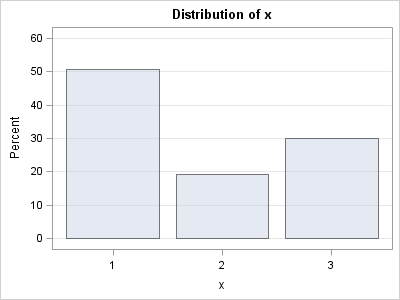
In either case, you can use PROC FREQ or PROC SGPLOT to visualize the sampled data. The following graph shows that the percentages of the three items in the sample are very close to 50%, 20%, and 30%:
ods graphics on; proc freq data=Sample; table x / plots=FreqPlot(scale=percent); run; |
Simulation of Categorical Data by Using the SAS/IML Language
The program statements are similar, but in the SAS/IML language you use the RANDSEED function to set the random number seed and the RANDGEN function to fill an entire matrix of values in a single call:
proc iml;
prob = {0.5, 0.2, 0.3};
N = 10;  /** samples in each trial **/
NumTrials = 1000; /** number of trials **/

sample = j(N, NumTrials); /** allocate **/
call randseed(12345);
call randgen(sample, "table", prob); /** fill **/ |
The SAS/IML statements generate 10,000 random integers from the set {1,2,3} and pack those values into a 10x1000 matrix. This arrangement is convenient for estimating probabilities that are associated with the experiment "choose 10 socks with replacement." (See my Sampling with Replacement article for more details.) You can use this simulation to answer questions such as "how often will the sample contains fewer than 2 black socks?"
I cover this technique and many others in my course "Data Simulation for Evaluating Statistical Methods in SAS," which I first presented at SAS Global Forum 2010. I am repeating the course at the following two conferences:

10 Comments
The "hard way" isn't really too hard:
raw = uniform(0);
cat = (raw > .5) + (raw > .7);
Yes, and it is still a good technique! The RAND("Table",...) technique is easier to read and is more compact when the probabilities are in an array. As a bonus, it enables you to use the sampling probabilities directly, instead of the cumulative sums.
Pingback: Generate a random sample from a mixture distribution - The DO Loop
I greately appriciate your work. I am a graduate student and doing my thesis. I want to generalize a data set for given cov. structre. I used your macro programme you have posted. But it is coming from only normal distribution. I need to generalise from several distribution like cauchy, chisquared,lognormal, etc.... (for repeated data) I already bought your 1st sas iml book. I know your next book will give everything what I need. I called to the publisher to buy your book. But it will be released in next month and too late for me. Please can I buy that book soon? If you can give me some idea or macro programme It will be greate help for me. However, I need to buy your next book too. Please let me know.. Thank you very much...
I'm sorry for your time constraints. The book is being edited. After that, the index needs to be created. Then the book will be available. If you have specific questions, try posting them on an online discussion forum such as the SAS-L mailing list or one of the SAS Community forums at https://communities.sas.com/community/support-communities Perhaps someone has done something similar and can point you in the right direction.
Pingback: Alternate ways to simulate multinomial data - The DO Loop
Pingback: The drunkard's walk in 2-D - The DO Loop
How to generate a set of random wights(wi)/probabilities(pi) such that sum(pi)=1/sum(wi)=1, i=1,2.....,k
OR
How to generate K values between 0 and 1 such that their sum is always?
Pingback: Create training, validation, and test data sets in SAS - The DO Loop
Pingback: Simulate from a Markov model - The DO Loop