Search Results: two ways to create ODS statistical graphics (53)

Rick Wicklin 2
Rotation matrices and 3-D data

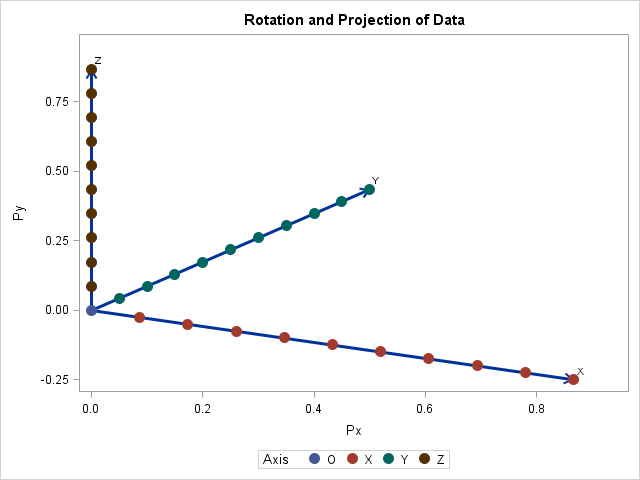
Rotation matrices are used in computer graphics and in statistical analyses. A rotation matrix is especially easy to implement in a matrix language such as the SAS Interactive Matrix Language (SAS/IML). This article shows how to implement three-dimensional rotation matrices and use them to rotate a 3-D point cloud. Define

Rick Wicklin 2
What is loess regression?

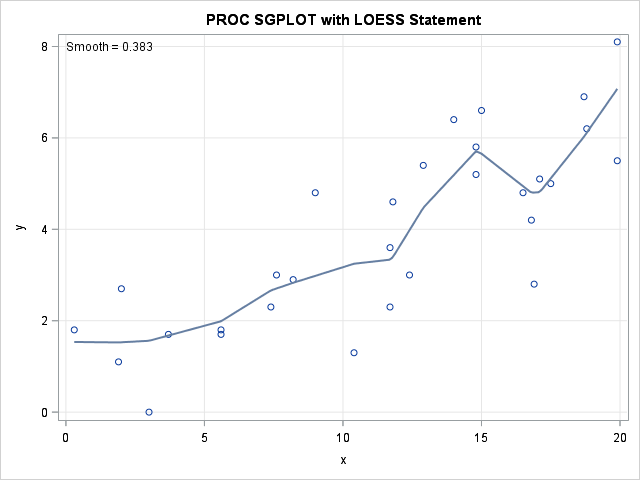
Loess regression is a nonparametric technique that uses local weighted regression to fit a smooth curve through points in a scatter plot. Loess curves are can reveal trends and cycles in data that might be difficult to model with a parametric curve. Loess regression is one of several algorithms in

Rick Wicklin 7
Visualize missing data in SAS

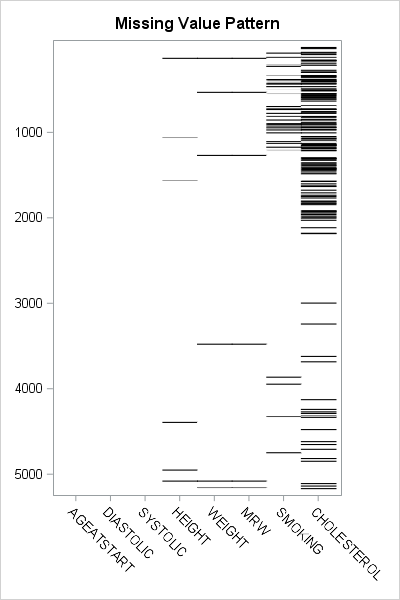
You can visualize missing data. It sounds like an oxymoron, but it is true. How can you draw graphs of something that is missing? In a previous article, I showed how you can use PROC MI in SAS/STAT software to create a table that shows patterns of missing data in

Rick Wicklin 11
Visualizing the causes of airline crashes

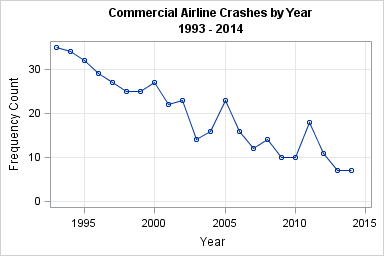
There has been a spate of recent high-profile airline crashes (Malaysia Airlines, TransAsia Airways, Germanwings,...) so I was surprised when I saw a time series plot of the number of airline crashes by year, which indicates that the annual number of airline crashes has been decreasing since 1993. The data

1 3 4 5 6