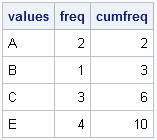
A reader asked: I want to create a vector as follows. Suppose there are two given vectors x=[A B C] and f=[1 2 3]. Here f indicates the frequency vector. I hope to generate a vector c=[A B B C C C]. I am trying to use the REPEAT function

A reader asked: I want to create a vector as follows. Suppose there are two given vectors x=[A B C] and f=[1 2 3]. Here f indicates the frequency vector. I hope to generate a vector c=[A B B C C C]. I am trying to use the REPEAT function

To a statistician, the DIF function (which was introduced in SAS/IML 9.22) is useful for time series analysis. To a numerical analyst and a statistical programmer, the function has many other uses, including computing finite differences. The DIF function computes the difference between the original vector and a shifted version

To a statistician, the LAG function (which was introduced in SAS/IML 9.22) is useful for time series analysis. To a numerical analyst and a statistical programmer, the function provides a convenient way to compute quantitites that involve adjacent values in any vector. The LAG function is essentially a "shift operator."

I blog about a lot of topics, but the following five categories represent some of my favorite subjects. Judging by the number of readers and comments, these articles have struck a chord with SAS users. If you haven't read them, check them out. (If you HAVE read them, some are
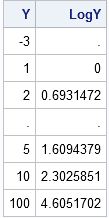
SAS software provides many run-time functions that you can call from your SAS/IML or DATA step programs. The SAS/IML language has several hundred built-in statistical functions, and Base SAS software contains hundreds more. However, it is common for statistical programmers to extend the run-time library to include special user-defined functions.
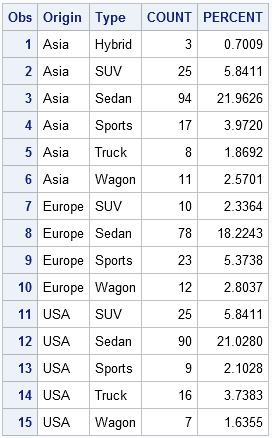
Because the SAS/IML language is a general purpose programming language, it doesn't have a BY statement like most other SAS procedures (such as PROC REG). However, there are several ways to loop over categorical variables and perform an analysis on the observations in each category. One way is to use
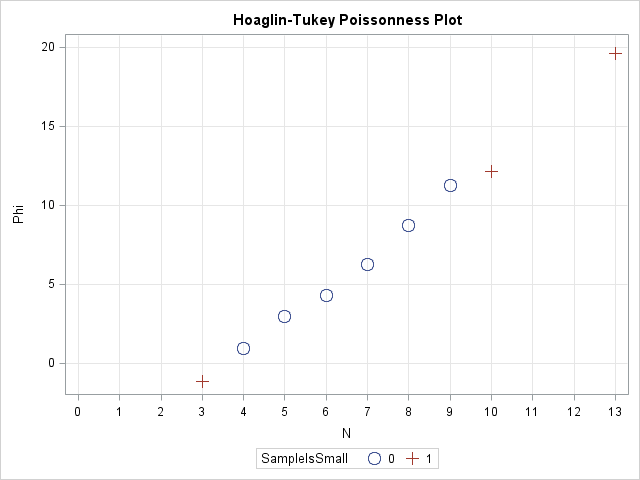
Last week I discussed how to fit a Poisson distribution to data. The technique, which involves using the GENMOD procedure, produces a table of some goodness-of-fit statistics, but I find it useful to also produce a graph that indicates the goodness of fit. For continuous distributions, the quantile-quantile (Q-Q) plot
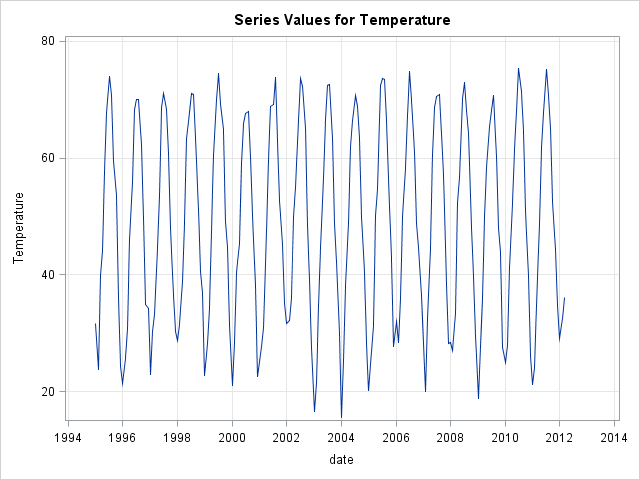
Last week I blogged about how to construct a smoother for a time series for the temperature in Albany, NY from 1995 to March, 2012. I smoothed the data by "folding" the time series into a single "year" that contains repeated measurements for each day of the year. Experts in
The birthday matching problem is a classic problem in probability theory. The part of it that people tend to remember is that in a room of 23 people, there is greater than 50% chance that two people in the room share a birthday. But the birthday matching problem is also
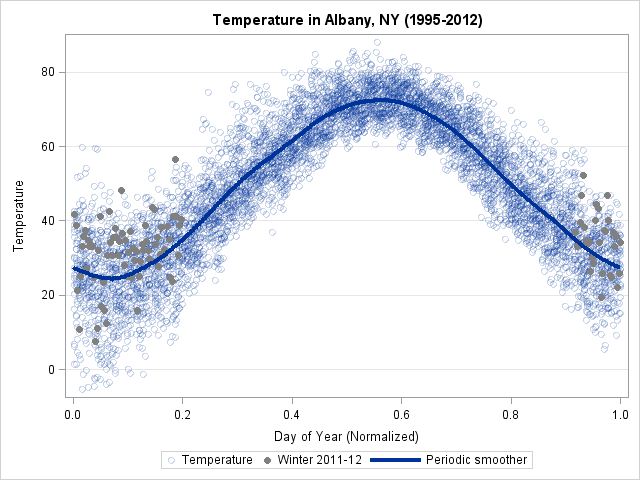
In yesterday's post, I discussed a "quick and dirty" method to smooth periodic data. However, after I smoothed the data I remarked that the smoother itself was not exactly periodic. At the end points of the periodic interval, the smoother did not have equal slopes and the method does not