Part of the power of the SAS ODS system is the ability to visualize data by using ODS templates. An ODS template describes how to render data as a table or as a graph. A lot of papers and documentation have been written about how to define a custom template to display data in a table or graph. However, it is worth remembering that you can also use the built-in SAS templates to format your own data. This article looks at two applications. First, the article shows how to display a subset of rows for an output table. Second, it shows how to use a SAS template to display data in a table that looks like the output from a SAS procedure.
Display only certain rows of an output table
First, let's suppose that a SAS procedure displays a very long table. Perhaps only a few of those rows are interesting. I've seen some presentations in which the speaker copies the entire table into PowerPoint and then highlights a few rows in the table. Because the table must be reduced to fit on the slide, the table is tiny, and the audience cannot read any of the text. A better approach is to get SAS to display only the rows of the table that you want to discuss.
To illustrate this situation, consider the following table of parameter estimates from PROC GLM in SAS. The model includes interactions between two classification variables, which results in a very long table that displays many effects, most of which are not significant.
ods trace on; /* display template names in log */ proc glm data=sashelp.cars(where=(cylinders in (4,6,8))); class origin cylinders; model MPG_City = weight horsepower origin | cylinders / solution; ods select ParameterEstimates; ods output ParameterEstimates=PE; /* store the data in the ParameterEstimates table */ quit; ods trace off; |
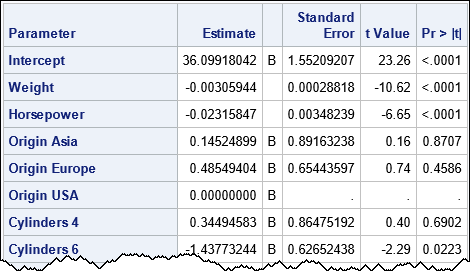
The full table has 18 rows. To save space, I have shown only the first few rows.
In addition, to the ODS table, the ODS TRACE ON statement displays the following information in the SAS log:
Name: ParameterEstimates Label: Solution Template: stat.GLM.Estimates Path: GLM.ANOVA.MPG_City.ParameterEstimates |
This information is important. It tells you that the table is rendered by using the STAT.GLM.Estimates template. The template describes how the parameter estimates table is rendered: the order of the columns, the column headers, the format for the columns, and so forth. If you apply the same template to any other data set, you will get a similar looking table, provided that the data set has the variables that the template requires.
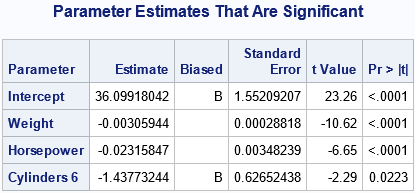
Suppose you want to communicate the fact that only four effects in the model are statistically significant. To do this, you can display a new table that shows only the rows for the significant effects. You can use a WHERE clause to select certain rows of the PE data set. You can use the SGRENDER procedure to specify a data set and a template. SAS will use the template to display the data, as shown by the following example:
title "Parameter Estimates That Are Significant"; proc sgrender data=PE template=STAT.GLM.Estimates; where probt is not missing and probt < 0.05; /* only keep rows for which p-value < 0.05 */ run; |
This is a powerful technique. I learned it from Warren Kuhfeld, who used it in many ways. You can read more about this technique in the SAS/STAT User's Guide. The example "ODS Output Data Sets and Using PROC TEMPLATE to Customize Output" shows how to use PROC SGRENDER to display a table by using a built-in ODS template.
Use templates to format your own data
In the previous section, the data is the output of a previous run of PROC GLM. But you can use the template to format any data. For example, suppose you see a table of results in some journal or web site. You do not have the original data. You want to include this table in a presentation, and you want it to look like the other tables in your presentation, which are SAS output tables. You can, of course, type the data into SAS and use PROC PRINT, but a better way is to use a SAS template to display the data.
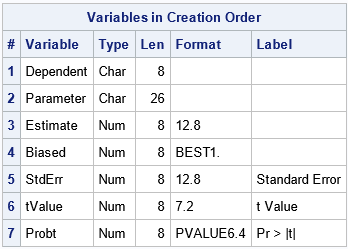
To use a template, you must create a SAS data set that has the same variable names (and types) that the template requires. For example, suppose you want to use the STAT.GLM.Estimates template to format some parameter estimates. You can use PROC CONTENTS to examine the variable names and lengths for the PE data set, which contains the data underlying the ParameterEstimates table for PROC GLM:
proc contents data=PE varnum; ods select Position; run; |
To use the STAT.GLM.Estimates template, you must create variables that have the same names and types. If a template cannot find a variable, the corresponding column of the table will be omitted. For example, the following data set defines variables and values for a parameter estimates table. The BIASED variable is not supplied, so SAS does not display that column in the output table:
/* the data does not have a "Biased" column; the table will omit the column */ data JournalData; length Dependent $12 Parameter $20; input Dependent Parameter Estimate StdErr tValue Probt; datalines; Cholesterol Intercept 161.73 4.56 35.17 0.00001 Cholesterol MRW 0.172 0.034 5.14 0.00001 Cholesterol Smoking 0.046 0.052 0.88 0.3783 Cholesterol Systolic 0.325 0.026 11.63 0.048 ; title "Parameter Estimates From Other Software"; proc sgrender data=JournalData template=STAT.GLM.Estimates; run; |
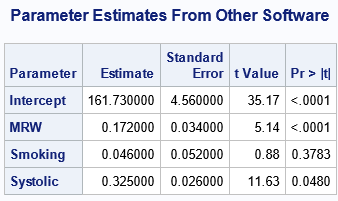
The table looks like the output from PROC GLM because the ODS system used the same template to render it.
Summary
This article shows two applications of using a built-in ODS template to render data. First, the article shows how to display a subset of rows for an output table. Second, it shows how to use a SAS template to display arbitrary data in a table. The table looks like the output from a SAS procedure because it is rendered with the same column headers, formats, and so forth.
