A SAS customer asked how to specify interaction effects between a classification variable and a spline effect in a SAS regression procedure. There are at least two ways to do this. If the SAS procedure supports the EFFECT statement, you can build the interaction term in the MODEL statement. For procedures that do not support the EFFECT statement, you can generate the interaction effects yourself. Because the customer's question was specifically about the GAMPL procedure, which fits generalized additive models, I also show a third technique, which enables you to model interactions in the GAMPL procedure.
To illustrate the problem, consider the following SAS DATA step, which simulates data from two different response functions:
data Have; call streaminit(1); Group="A"; do x = 1 to 10 by .1; y = 2*x + sin(x) + rand("Normal"); output; end; Group="B"; do x = 1 to 10 by .1; y = 10 - x - sin(x) + rand("Normal"); output; end; run; |
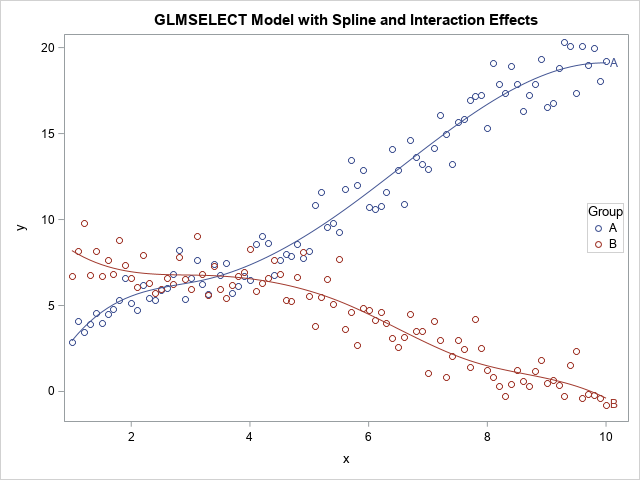
The graph shows the data and overlays a regression model. The model predicts the response for each level of the Group variable. Notice that the two curves have different shapes, which means that there is an interaction between the Group variable and the x variable. The goal of this article is to show how to use a spline effect to predict the response for each group.
Use the grammar of the procedure to form interactions
Many SAS regression procedures support the EFFECT statement, the CLASS statement, and enable you to specify interactions on the MODEL statement. Examples include the GLMMIX, GLMSELECT, LOGISTIC, QUANTREG, and ROBUSTREG procedures. For example, the following call to PROC GLMSELECT specifies several model effects by using the "stars and bars" syntax:
- The syntax Group | x includes the classification effect (Group), a linear effect (x), and an interaction effect (Group*x).
- The syntax Group * spl includes an interaction effect between the classification variable and the spline.
title "GLMSELECT Model with Spline and Interaction Effects"; ods select none; proc glmselect data=Have outdesign(addinputvars fullmodel)=SplineBasis; /* optional: write design matrix to data set */ class Group; effect spl = spline(x); model y = Group|x Group*spl / selection=none; output out=SplineOut predicted=p; /* output predicted values */ quit; ods select all; %macro PlotInteraction(dsname); proc sgplot data=&dsname; scatter x=x y=y / group=Group; series x=x y=p / group=Group curvelabel; keylegend / location=inside position=E; run; %mend; %PlotInteraction(SplineOut); |
The predicted curves are shown in the previous section. I wrapped the call to PROC SGPLOT in a macro so that I can create the same plot for other models.
Output the design matrix for the interactions
Some SAS procedures do not support the EFFECT statement. For these procedures, you cannot form effects like Group*spline(x) within the procedure. However, the GLMSELECT procedure supports the OUTDESIGN= option, which writes the design matrix to a SAS data set. I used the option in the previous section to create the SplineBasis data set. The data set includes variables for the spline basis and for the interaction between the Group variable and the spline basis. Therefore, you can use the splines and interactions with splines in other SAS procedures.
For example, the GLM procedure does not support the EFFECT statement, so you cannot generate a spline basis within the procedure. However, you can read the design matrix from the previous call to PROC GLMSELECT. The interaction effects are named spl_Group_1_A, spl_Group_1_B, spl_Group_2_A, ...., where the suffix "_i_j" indicates the interaction effect between the i_th spline basis and the j_th level of the Group variable. You can type the names of the design variables, or you can use the "colon notation" to match all variables that begin with the prefix "spl_Group". The following call to PROC GLM computes the same model as in the previous section:
proc glm data=SplineBasis; class Group; model y = Group|x spl_Group: ; /* spl_Group: => spl_Group_1_A, spl_Group_1_B, ... */ output out=GLMOut predicted=p; /* output predicted values */ quit; /* show that the predicted values are the same */ data Comp; merge SplineOut GLMOut(keep=p rename=(p=p2)); diff = p - p2; run; proc means data=comp Mean Min Max; var diff; run; |
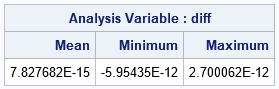
The output of PROC MEANS shows that the two models are the same. There is no difference between the predicted values from PROC GLM (which reads the design matrix) and the values from PROC GLMSELECT (which reads the raw data).
The splines of the interactions versus the interactions of the splines
Some nonparametric regression procedures, such as the GAMPL procedure, have their own syntax to generate spline effects. In fact, PROC GAMPL uses thin-plate splines, which are different from the splines that are supported by the EFFECT statement. Recently, a SAS customer asked how he could model interaction terms in PROC GAMPL.
The GAMPL procedure supports semiparametric models. In the parametric portion of the model, it is easy to specify interactions by using the standard "stars and bars" notation in SAS. However, the SPLINE() transformation in PROC GAMPL does not support interactions between a classification variable and a continuous variable. To be specific, consider the following semiparametric model:
title "No Interaction Between Classification and Spline Effects"; proc gampl data=Have; *plots=components; class Group; model Y = param(Group | x) /* parametric terms */ spline(x); /* nonprametric, but no interaction */ output out=GamPLOut pred=p r=r; id Y X Group; run; %PlotInteraction(SplineOut); |
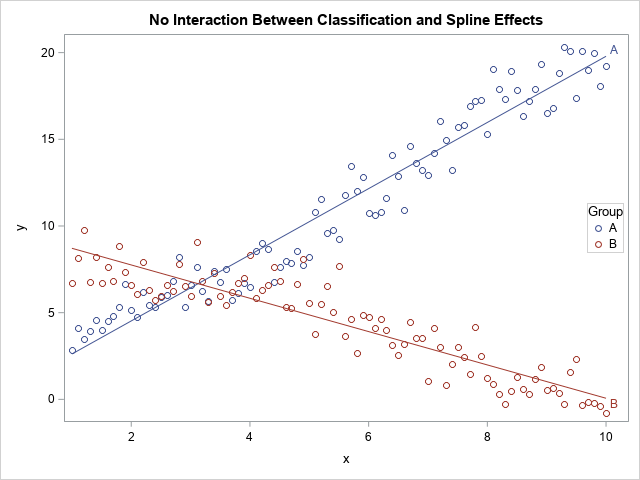
The output shows that the model does not capture the nonlinear features of the data. This is because the spline term is computed for all values of x, not separately for each group. When the groups are combined, the spline effect is essentially linear, which is probably not the best model for these data.
Unfortunately, in SAS/STAT 15.1, PROC GAMPL does not support a syntax such as "spline(Group*x)", which would enable the shape of the nonparametric curve to vary between levels of the Group variable. In fact, the 15.1 documentation states, "only continuous variables (not classification variables) can be specified in spline-effects."
However, if your goal is to use a flexible model to fit the data, there is a model that might work. Instead of the interaction between the Group variable and spline(x), you could use the spline effects for the interaction between the Group variable and x. These are not the same models: the interaction with the splines is not equal to the spline of the interactions! However, let's see how to fit this model to these data.
The idea is to form the interaction effect Group*x in a separate step. You can use the design matrix (SplineBasis) that was created in the first section, but to make the process as transparent as possible, I am going to manually generate the dummy variables for the interaction effect Group*x:
data Interact; set Have; x_Group_A = x*(Group='A'); x_Group_B = x*(Group='B'); run; |
You can use the spline effects for the variable x_Group_A and x_Group_B in regression models. The following model is not the same as the previous models, but is a flexible model that seems to fit these data:
title "Interaction Between Classification and Spline Effects"; proc gampl data=Interact plots=components; class Group; model Y = param(Group | x) spline(x_Group_A) spline(x_Group_B); /* splines of interactions */ output out=GamPLOut pred=p; id Y X Group; run; title "GAMPL with Interaction Effects"; %PlotInteraction(GamPLOut); |
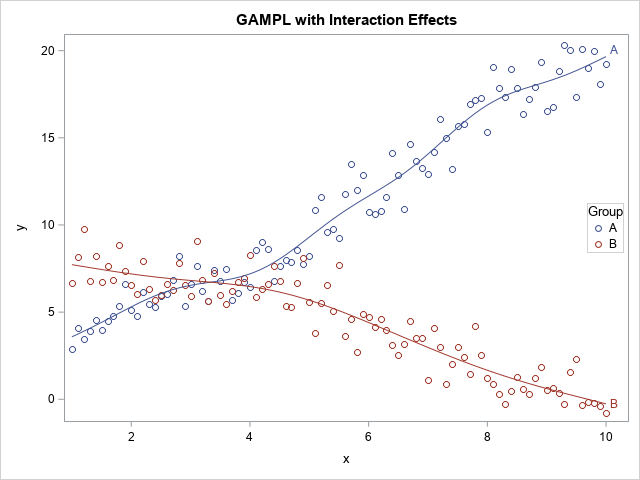
The graph shows that (visually) the model seems to capture the undulations in the data as well as the earlier model. Although PROC GAMPL does not currently support interactions between classification variables and spline effects, this trick provides a way to model the data.
