A recent question on a SAS Discussion Forum was "how can you overlay multiple kernel density estimates on a single plot?" There are three ways to do this, depending on your goals and objectives.
Overlay different estimates of the same variable
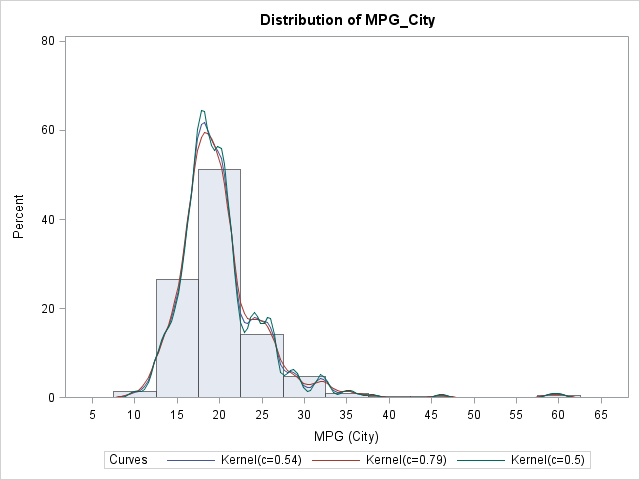
Sometimes you have a single variable and want to overlay various density estimates, either parametric or nonparametric. You can use the HISTOGRAM statement in the UNIVARIATE procedure to accomplish this. The following SAS code overlays three kernel density estimates with different bandwidths on a histogram of the MPG_CITY variable in the SASHelp.Cars data set:
/* use UNIVARIATE to overlay different estimates of the same variable */ proc univariate data=sashelp.cars; var mpg_city; histogram / kernel(C=SJPI MISE 0.5); /* three bandwidths */ run; |
In the same way, you can overlay various parametric estimates and combine parametric and nonparametric estimates.
Overlay estimates of different variables
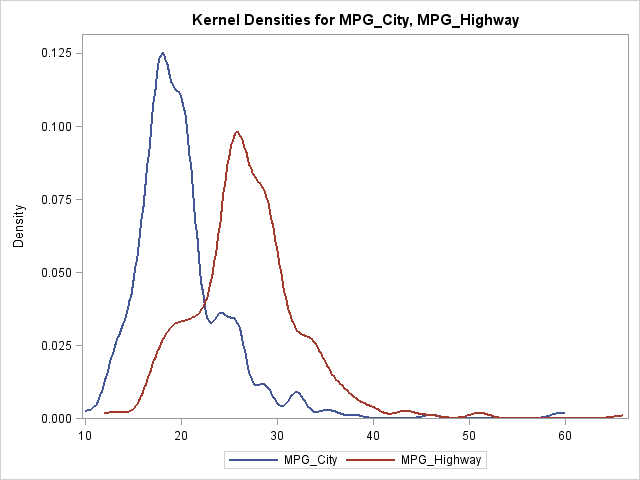
Sometimes you might want to overlay the density estimates of several variables in order to compare their densities. You can use the KDE procedure to accomplish this by using the PLOTS=DensityOverlay graph. The following SAS code overlays the density curves of two different variables: the miles per gallon for vehicles in the city and the miles per gallon for the same variables on the highway:
/* use KDE to overlay estimates of different variables */ proc kde data=sashelp.cars; univar mpg_city mpg_highway / plots=densityoverlay; run; |
Overlay arbitrary densities
Sometimes you might need to overlay density estimates that come from multiple sources. For example, you might use PROC UNIVARIATE construct a parametric density estimate, but overlay it on a density estimate that you computed by using PROC KDE or that you computed yourself by writing an algorithm in PROC IML. In these cases, you want to write the density estimates to a data set, combine them with the DATA step, and plot them using the SERIES statement in PROC SGPLOT.
There are three ways to get density estimates in a data set:
- In PROC KDE, the UNIVAR statement has an OUT= option that you can use to write the density estimate to a SAS data set.
- In PROC UNIVARIATE, the HISTOGRAM statement has an OUTKERNEL= option that you can use to write the kernel density estimate to a SAS data set.
- For parametric estimates that are computed in PROC UNIVARIATE, you can use the ODS OUTPUT statement to save the ParameterEstimates table to a SAS data set. You can then use a DATA step in conjunction with the PDF function to create the (x,y) values along a parametric density curve.
For some of these situations, you might need to transpose a data set from a long format to a wide format. For extremely complicated graphs that overlay multiples density estimates on a histogram, you might need to use PROC SGRENDER and the Graphics Template Language (GTL).
If you prefer to panel (rather than overlay) density estimates for different levels of a classification variable, the SAS & R blog shows an example that uses the SGPANEL procedure.

3 Comments
Excellent methods. A fourth way is using PROC SGPLOT; and a fifth way, allowing more extensions and flexibility, is PROC SGRENDER.
SAS always has many ways to do things!
I had missed the densityoverlay option in proc KDE. Nice!
As always, you get more control using proc gplot (here with the a*b = c syntax in the plot statement) than proc sgplot (using the series statement).
Pingback: How to overlay a custom density curve on a histogram in SAS - The DO Loop