Sometimes it is convenient to reshape the data in a matrix. Suppose you have a 1 x 12 matrix. This same data can fit into several matrices with different dimensions: a 2 x 6 matrix, a 3 x 4 matrix, a 4 x 3 matrix, and so on.
The SHAPE function enables you to specify the number of rows and columns for a new matrix. The values for the new matrix come from an existing matrix, as shown in the following statements:
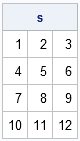
proc iml; x = 1:12; /** 1 x 12 matrix **/ s = shape(x, 4, 3); /** reshape data into 4 x 3 matrix **/ print s; |
The data in SAS/IML matrices are stored in row-major order and this ordering of the elements is used in reshaping the data. The SHAPE function does not change the order of the data elements in memory; it merely changes how those data are interpreted as a matrix.
Tip: Data in SAS/IML matrices are stored in row-major order.
The preceding example specifies both the number of rows and the number of columns to the SHAPE function. You can also specify only the number of rows or only the number of columns. The dimension that is not specified is determined automatically by dividing the number of elements in the matrix by the number of specified rows or columns. To specify only the number of rows, omit the third argument or use 0 for the number of columns. To specify only the number of columns, specify 0 for the number of rows, as shown in the following statements:
s1 = shape(x, 4); /** 4 rows ==> 3 columns **/ s2 = shape(x, 0, 3); /** 3 columns ==> 4 rows **/ |
The s1 and s2 matrices are identical to the s matrix.
This tip and example are taken from Chapter 2 of my book Statistical Programming with SAS/IML Software

3 Comments
Pingback: Computing pairwise differences (efficiently, of course) - The DO Loop
Pingback: Plotting multiple time series in SAS/IML (Wide to Long, Part 2) - The DO Loop
Pingback: Flip it. Flip it good. - The DO Loop