Missing data can be informative. Sometimes missing values in one variable are related to missing values in another variable. Other times missing values in one variable are independent of missing values in other variables. As part of the exploratory phase of data analysis, you should investigate whether there are patterns in the missing data.
Counting is the simplest analysis of any data (missing or otherwise). For each variable, how many observations are missing? You can then proceed to more complex analyses. Do two variable share a similar missing value pattern? Can you predict that one variable will be missing if you know that another variable is missing?
Missing data can be informative. Examine patterns of missing data #Statistics #SAStip Click To TweetThis article shows a simple way to examine patterns of missing values in SAS. The example data is the Sashelp.Heart data set, which contains information about patients in the Framingham Heart Study. The meaning of most variables is evident from the variable's name. An exception is the MRW variable, which contains a patient's "Metropolitan Relative Weight." The MRW is a percentage of the patient's weight to an ideal weight. Thus an MRW score of 100 means "ideal weight" whereas a score of 150 means "50% heavier than ideal." The MRW is similar to the more familiar body-mass index (BMI).
The number of missing values for each variable
I have previously shown how to use PROC FREQ to count the number of missing values for numeric and character variables. The technique uses a custom format to classify each value as "Missing" or "Not Missing."
Alternatively, for numeric variables you can use PROC MEANS to count the number of missing values. PROC MEANS creates a compact easy-to-read table that summarizes the number of missing values for each numerical variable. The following statements use the N and NMISS options in the PROC MEANS statement to count the number of missing values in eight numerical variables in the Sashelp.Heart data set:
/* count missing values for numeric variables */ proc means data=Sashelp.Heart nolabel N NMISS; var AgeAtStart Diastolic Systolic Height Weight MRW Smoking Cholesterol; run; |
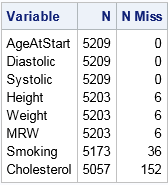
The NMISS column in the table shows the number of missing values for each variable. There are 5209 observations in the data set. Three variables have zero missing values, and another three have six missing values. The Smoking variable has 36 missing values whereas the Cholesterol variable has 152 missing values.
These univariate counts are helpful, but they do not tell you whether missing values for different variables are related. For example, there are six missing values for the Height, Weight, and MRW variables. How many patients contributed to those six missing value? Ten? Twelve? Perhaps there are only six patients, each with missing values for all three variables? If a patient has a missing Height, does that imply that Weight or MRW is missing also? To answer these questions you must look at the pattern of missing values.
Patterns of missing values
The MI procedure in SAS/STAT software is used for multiple imputation of missing values. PROC MI has an option to produce a table that summarizes the patterns of missing values among the observations. The following call to PROC MI uses the NIMPUTE=0 option to create the "Missing Data Patterns" table for the specified variables:
ods select MissPattern; proc mi data=Sashelp.Heart nimpute=0; var AgeAtStart Height Weight Diastolic Systolic MRW Smoking Cholesterol; run; |
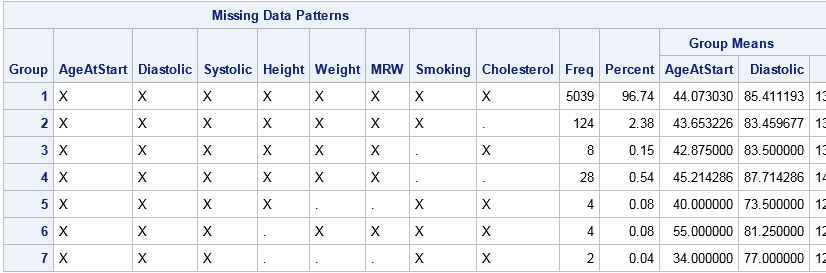
The table reports the number of observations that have a common pattern of missing values. In addition to counts, the table reports mean values for each group. Because the table is very wide, I have truncated some of the mean values.
The first row counts the number of complete observation. There are 5039 observations that have no missing values.
Subsequent rows report the number of missing values for variables, pairs of variables, triplets of variables, and so forth. The variables are analyzed from right to left. Thus the second row shows that 124 observations have missing values for only the rightmost variable, which is Cholesterol. The third row shows that eight observations have missing values for only the Smoking variable. The fourth row shows that 28 observations have missing values for both Smoking and Cholesterol.
The table continues by analyzing the remaining variables that have missing values, which are Height, Weight, and MRW. You can see that MRW is never missing by itself, but that it is always missing when Weight is missing. Height is missing by itself in four cases, and is missing simultaneously with Weight in two cases.
Notice that each row of the table represents a disjoint set of observations. Consequently, we can easily answer the previous questions about how many patients contribute to the missing values in Height and Weight. There are 10 patients: four are missing only the Height measurement, four are missing only the Weight measurement (which forces MRW to be missing), and two are missing both Height and Weight.
This preliminary analysis has provided important information about the distribution of missing data in the Sashelp.Heart data set. Most patients (96.7%) have complete data. The most likely measurement to be missing is Cholesterol, followed by information about whether the patient smokes. You can see exactly how many patients are missing Height measurements, Weight measurements, or both. It is obvious that the MRW variable has a missing value if and only if the Weight variable is missing.
The "Missing Data Patterns" table from PROC MI provides a useful summary of missing values for each combination of variables. Examining patterns of missing values can lead to insight into the data collection process, and is also the first step prior to modeling missing data by using multiple imputation. In my next post, I will show how to use basic graphics to visualize patterns of missing data.

10 Comments
Rick: thanks for the post/blog. Would you please write on different approaches to examining types of missing data ( title="MCAR, MAR, MNAR") in SAS (for instance, with title="SAS PROC MCMC").
Thanks for the tip. Out of curiosity I just tried it with some data I am investigating right now. Some of the variables are nominal or ordinal character. Making PROC MI simply report the missing pattern of those looks challenging. Can you advise?
If you want only the missing value pattern, it's not too hard. List all classification variables on a CLASS statement. Also include the FCS statement. You will get a few warnings, but you can ignore them because you aren't doing imputation:
Ah. Thanks. I am still on 9.2, which has no FCS statement. I'm planning to migrate to 9.4 this year.
Pingback: Visualize missing data in SAS - The DO Loop
Pingback: Create patterns of missing data - The DO Loop
Pingback: Counting observations for which two events occur - The DO Loop
Rick, Thank you so much.
Pingback: Visualize missing data in SAS - The DO Loop
Pingback: 10 tips for creating effective statistical graphics - The DO Loop