Every year near Halloween I write an article in which I demonstrate a simple programming trick that is a real treat to use. This year's trick (which features the CMISS function and the crossproducts matrix in SAS/IML) enables you to count the number of observations that are missing for pairs of columns. In other words, this trick counts how many missing values are in columns 1 and 2, columns 1 and 3, and so on for all "k choose 2" pairwise combinations of k columns.
This trick generalizes, so keep reading even if you don't care about counting missing values. Given ANY indicator matrix, you can use this trick to count the pairwise occurrence of events.
Counting pairwise events: A connection to matrix multiplication #Statistics Share on XCounting missing values
Of course, you can count combinations of missing values without using SAS/IML or matrices. I've previously shown how to use PROC MI to count all combinations of missing values among a set of k variables. However, as I said, this SAS/IML trick enables you to count more than just missing values: it generalizes to count ANY pairwise event.
To get started, read data into a SAS/IML matrix. The following statements read 5209 observations and eight variables into the matrix X:
proc iml;
varNames = {"AgeAtStart" "Diastolic" "Systolic"
            "Height" "Weight" "MRW" "Smoking" "Cholesterol"};
use Sashelp.Heart;               /* open data set */
read all var varNames into X;    /* create numeric data matrix, X */
close Sashelp.Heart; |
The first part of the trick is to convert the matrix into a 0/1 indicator matrix, where 1 indicates that a data value is missing and 0 indicates nonmissing. I like to use the CMISS function in Base SAS for this task.
The second part of the trick is to recognize that if C is an indicator matrix, the crossproducts matrix P=C`C is a matrix that gives the counts of the pairwise events in C. The element P[i,j] is the inner product of the i_th and j_th columns of C, and because C is an indicator matrix the inner product counts the number of simultaneous "events" for column i and column j.
In the SAS/IML language, the code to compute pairwise counts of missing values requires only two lines:
C = cmiss(X); /* create 0/1 indicator matrix */ P = C`*C; /* pairwise counts */ print P[c=varNames r=varNames label="Pairwise Missing Counts"]; |
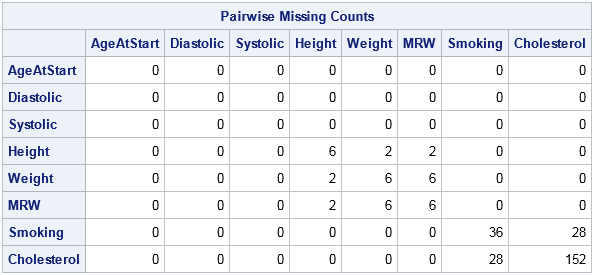
The P matrix is symmetric. The diagonal elements P[i,i] show the number of missing values for the i_th variable. For example, the Height, Weight, and MRW variables have 6 missing values whereas the Cholesterol variable has 152 missing values. The off-diagonal elements P[i,j] show the number of observations that are simultaneously missing for the i_th and j_th variables. For example, 28 observations have missing values for both the Smoking and Cholesterol variables; two observations have missing values for both the Height and Weight variables.
Counting any pair of events
If C is any indicator matrix, the crossproducts matrix P=C`C counts the number of observations for which two columns of C are simultaneously 1.
For example, the following statements standardize the data to create z-scores. You can form an indicator matrix that has the value 1 if a z-score is exceeds 3 in absolute value; these are outliers for normally distributed data. The crossproducts matrix counts the number of observations that are univariate outliers (on the diagonal) and the number that are outliers for a pair of variables:
Z = (X - mean(X)) / std(X); /* standardize data */ L = (abs(Z) > 3); /* L indicates outliers */ Q = L`*L; /* counts for pairs of outliers */ print Q[c=varNames r=varNames label="Pairwise Outliers"]; |
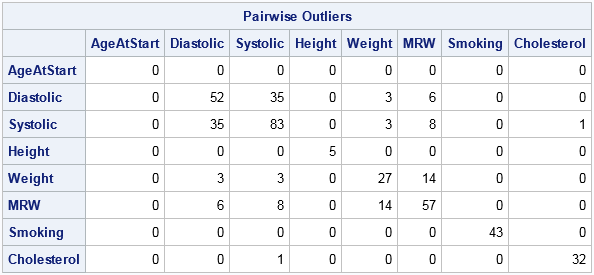
The table indicates that 52 patients have a diastolic blood pressure (BP) that is more than three standard deviations above the mean. Similarly, 83 patients are outliers for systolic BP, and 35 patients are outliers for both measurements.
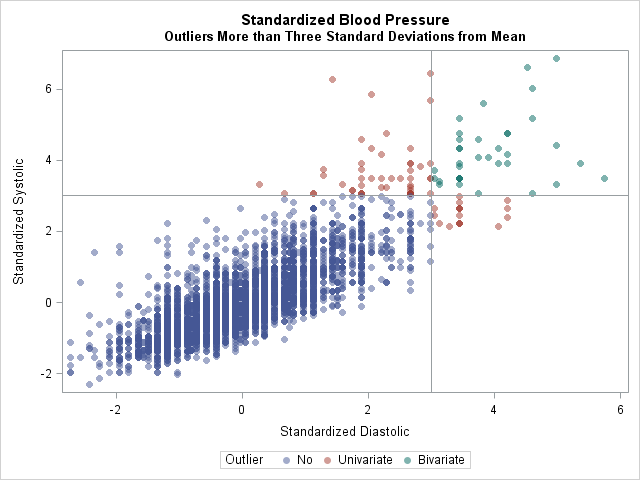
The following graph visualizes the patients that have high blood pressure in each category:
Outlier = j(nrow(L), 1, "No         ");       /* create grouping variable */
Outlier[ loc(L[,2] | L[,3]) ] = "Univariate";
Outlier[ loc(L[,2] & L[,3]) ] = "Bivariate";
title "Standardized Blood Pressure";
title2 "Outliers More than Three Standard Deviations from Mean";
call scatter(Z[,2], Z[,3]) group=Outlier
         label={"Standardized Diastolic" "Standardized Systolic"}
         option="transparency=0.5 markerattrs=(symbol=CircleFilled)"
other="refline 3/axis=x; refline 3/axis=y;"; |
In conclusion, you can create an indicator matrix for any set of conditions. By forming the crossproducts matrix, you get the counts of all observations that satisfy each condition individually and in pairs. I think this trick is a real treat!

10 Comments
Rick,
Actually I would not be fond of this kind of symmetric matrix.
It will be very big and cost many times when you have ten thousands of variables.
I would more like to use the following data step code.
Thanks for the comment. I understand your concerns, and your DATA step solution is worth looking at if
1) The indicator matrix is on disk as a SAS data set
2) You want the pairwise counts in a data set.
However, the SAS/IML solution is useful when the raw data are in a SAS/IML matrix and you need to
(A) form the indicator matrix and (B) count the pairwise relationships.
You claim that the crossproduct matrix will "cost many times when you have ten thousands of variables," but that assertion does not agree with timings that I ran. Matrix multiplication will be faster on multi-core machines with a math kernel library (provided, of course, that everything fits in RAM). For example, on my desktop PC the IML solution for 2000 variables takes about 3 seconds, whereas the DATA step and PROC FREQ solution takes about 8 minutes=240 seconds. For 5000 variables, the IML solution takes 11 seconds. I tried to time the DATA step/FREQ solution for 5000 variables, but I eventually gave up. Try it on the following example. I think you run IML under SAS University Edition, so you probably won't get the MKL performance boost.
Hi Rick,
Really enjoyed this article and learned a lot. I used PROC CORR
proc corr noprint nocorr sscp data=have out=sscp3;
var x:;
run;
Using your example data and IML took about 1minute on my computer while the PROC CORR took 20sec., but don't forget the NOPRINT option.
Thanks for writing. I assume you computed the SSCP for the binary matrix C, rather than the numerical matrix X. However, I don't understand your timings. The Sashelp.Heart data set only has 5209 observations, so both computations should be instantaneous for my example data. Perhaps your "Have" data set is simulated data with many more observations and variables?
That was on the test data you posted with X1-X2000, and 20,000 obs. Using your original data both methods are instantaneous.
Ahh, I see. I did not notice that you were responding to my response to KSharp.
Thanks for the alternative PROC CORR solution. Nice solution. I like it! I think your PROC CORR solution is a WINNER both for speed and ease-of-use. PROC CORR should be faster than IML crossproducts for non-threaded computations. On my system (SAS 9.4m3, multithreaded CPU with MKL), each computation takes about 2-2.5 seconds, but PROC CORR is simpler.
SAS' wonderful functions can do this for you too or am i missing something obvious?
var a b c
1 .m .d
sumchk = sum(of a,b,c);
or nmiss (a,b,c) if they're not 1/0/missings;
Your code gives the number of missing values in each row. That's not what this article is about.
i was thinking of columns as variables..and just setting up arrays to hold all the numeric vars and looping through them to get all the pairs of missing vars for each record and then counting the flags for each missing combo over the dataset.
You are welcome to implement your idea and post it. If there are k variables, you need to correctly fill an array that has k(k-1)/2 elements, since that is the number of pairwise combinations. You also need to create a label or name so that it is clear which element contains the counts for the combination of variable i and variable j.