A colleague jokingly teases me whenever I write a blog that demonstrates how to write fun and exciting programs by using SAS software. "Why do you get to have all the fun?" he mock-chides.
Today I'm ready to face his ribbing, because this article is about Conway's Game of Life and how to implement cellular automata in the SAS/IML language.
Cellular automata and Conway's Game of Life
Conway's Game of Life is a set of simple rules that give rise to beautiful regular and irregular patterns. The rules describes how cellular automata live or die based on the presence or absence of neighbors on a rectangular grid. This dynamical system is a "game" because it is fun to create some initial distribution of automata and watch the evolution of the system from that initial condition. Like many programmers, I wrap the edges of the grid so that the cells on the right and left sides of the grid are neighbors, and similarly for the cells on the top and bottom edges.
The following rules were used to evolve the automata:
- Birth Rule: An organism is born into any empty cell that has exactly three living neighbors.
- Survival Rule: An organism with either two or three neighbors survives from one generation to the next.
- Death Rule: An organism with four or more neighbors dies from overcrowding. An organism with fewer than two neighbors dies from loneliness.
The Game of Life in SAS/IML Studio
Almost every beginning programmer has attempted to program the Game of Life. In a matrix language such as SAS/IML, the implementation of the rules are particularly easy and compact. I first implemented the Game of Life in SAS/IML Studio in 2001. My program is part of the standard set of demo programs that are distributed with SAS/IML Studio. To access the program from the SAS/IML Studio menu, select File ⇒ Open ⇒ File. Then click Go to Installation directory. Select the Programs and Demos folders, then open the file Life.sx.
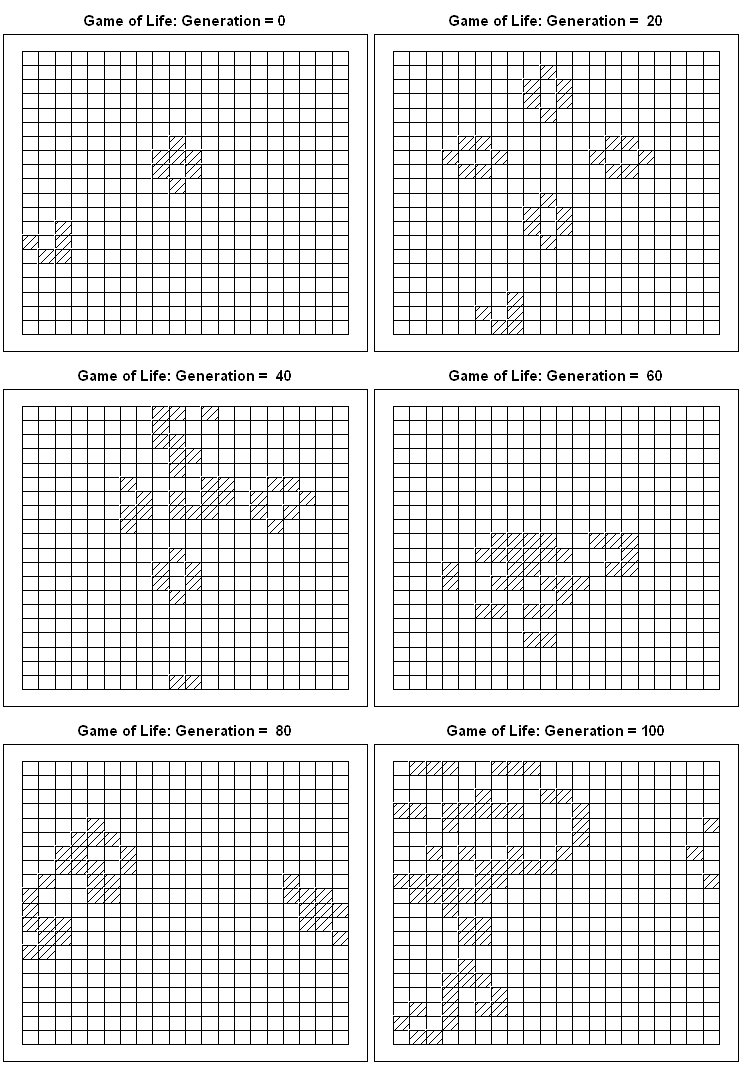
When you run the program, you are prompted for the size of a square grid (I like 20 rows and columns) and told to click on the grid to create an initial distribution of the automata. (Hold down the SHIFT key while you click.) The following animated GIF shows 100 steps that evolve from a simple initial condition that contains an "exploder" pattern and a "glider" pattern.

The interesting thing about this implementation in SAS/IML Studio is that I didn't program the animation at all. The "live" automata are observations that are selected in the grid. The program figures out which cells are alive and dead at the next generation and then simply tells the in-memory copy of the data to update the selected observations. The plot automatically updates to reflect the newly selected observations. To learn more about dynamically linked graphics and how to select observations in SAS/IML Studio, see my book Statistical Programming with SAS/IML Software, especially Chapters 6 and 10.
Recall that SAS/IML Studio is a free download and can be installed on a Windows PC and used by anyone who has a license for SAS/IML and SAS/STAT software. Unfortunately, SAS/IML Studio is not available for users of the free SAS University Edition. If you do not have access to SAS/IML Studio, here is a version of the Life.sx program. You can use the computational portions of the program in PROC IML, even though you cannot create the IMLPlus graphics.
Creating an animated GIF in SAS/IML Studio
When you run the program in SAS/IML Studio, the graphics are displayed on your PC monitor. So how did I create an animated GIF to embed in this blog post? It was surprisingly easy! In the IMLPlus program, the on-screen graph is controlled through a Java variable called plot. You can use the SaveToFile method to create a bitmap version of the graph. If you call that method within the loop that updates the graph for each new generation of automata, you get a sequence of bitmaps in some local directory, like this:
path = 'C:\Temp\AnimGif\Life\';       /* directory to store images */
plot.SaveToFile(path+"Life000.bmp");  /* save the initial configuration */
do i = 1 to nGenerations;             /* for each new generation */
   run update_generation( grid );     /* compute new configuration for automata */
   run Grid2Selection( dobj, grid );  /* update the selected observations */
   plot.SetTitleText("Game of Life: Generation = "+char(i,3));  /* update title */
   suffix = trim(putn(i, "Z3."));     /* 001, 002, ..., 100 */
   plot.SaveToFile(path+"Life"+suffix+".bmp"); /* save image to Life001.bmp */
end; |
After creating 100 bitmap images in a directory, you can create an animated GIF by using a program that stitches the images together in sequence. I used a freeware Java program called GiftedMotion, which does not require you to install any software. Just download the JAR file to your desktop, double click, and navigate to the directory that contains the images.

4 Comments
Very cool! And it is easy to expand the grid, although I don't think Conway's original idea of an infinite grid could be done. Is your grid like a sphere or a torus?
I am reading William Poundstones The Recursive Universe and it has a lot about the life game
The grid is wrapped into a torus.
Fun! Now make the grid a real projective plane. :-)
Pingback: Wolfram’s Rule 30 in SAS - The DO Loop