Earlier this week I posted a "guest blog" in which my 8th grade son described a visualization of data for the 2013 ASA Poster Competition. The purpose of today's blog post is to present a higher-level statistical analysis of the same data. I will use a t test and a regression analysis with a classification variable—two concepts that are not generally known to elementary school students. (If you like analyzing kids' experiments with SAS, see also Chris Hemedinger's 2011 analysis of his daughter's "Mentos and Coke" science fair project.)
The experiment measured the drying times for 40 loads of laundry. Each load was weighed upon emerging from the washing machine. For 20 loads, my son inserted two plastic "dryer balls" into the dryer with the laundry. The other 20 loads were dried without using dryer balls. Consequently, the variables are as follows:
- Weight: the weight, in grams, of the wet clothes
- Time: the time, in minutes, required to dry the clothes, as measured by an automatic "dampness sensor" in the dryer
- Balls: an indicator variable that has the value 1 if dryer balls were included in the dryer, and 0 otherwise
The data are available for download it you'd like to analyze these data on your own.
A t-test analysis
On average, does the presence of dryer balls result in shorter drying times? One way to answer this question is to ask whether the mean drying time is the same for the dryer-ball group as compared to the control loads:
proc ttest data=DryerBalls; class Balls; var Time; run; |

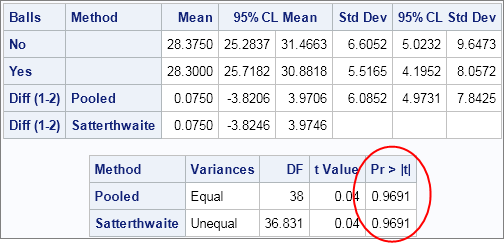
The comparative histograms and side-by-side box plots indicate that the distributions of drying times are similar for the two groups. Notice that the 95% confidence interval for the difference of the means includes 0. A t test produces a large p-value (circled), which indicates that the means are not significantly different.
A regression analysis
How does the drying time depend on the weight of the wet clothes and on the presence or absence of dryer balls? You can use the GLM procedure to model the relationship:
ods html style=htmlbluecml; proc glm data=DryerBalls plots=all; class Balls; model Time = Weight Balls / solution; run; |
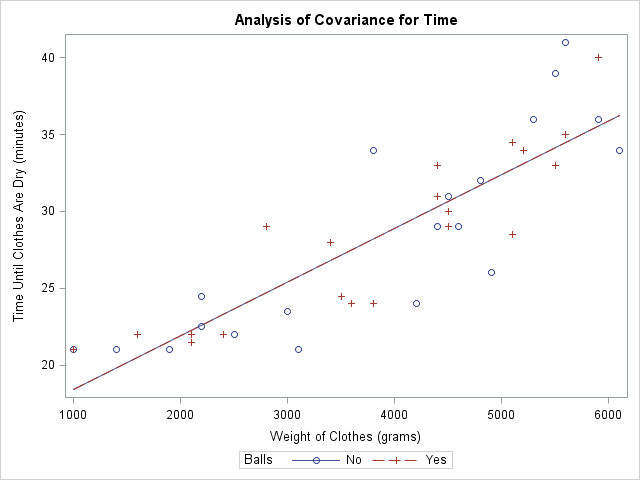
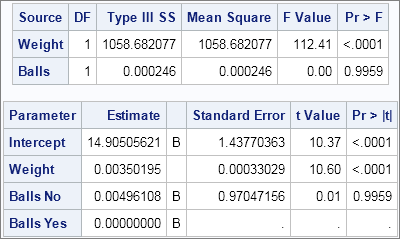
The fit plot tells the story. There are actually two lines in the plot, one for Balls=1 and the other for Balls=0. However, the lines are right on top of each other, so it looks like there is only one line. The type III sum of squares and the parameter estimates confirm that the Balls variable is not significant to the model. In other words, the presence or absence of dryer balls does not significantly affect the model for drying time when controlling for the weight of the clothes. The parameter estimates indicate that each additional kilogram of clothes adds about 3.5 minutes to the drying time.
I also fit a model that includes a quadratic term for the Weight variable, but the conclusion is the same: dryer balls do not affect drying time.
I am pleased that these more sophisticated statistical analyses give the same conclusions as my son observed while using more elementary methods. Can you think of additional analyses that would be appropriate? Download the data and let me know what you discover.

6 Comments
I presented these results to my Mom, who was using dryer balls in her household laundry. Her last ball recently went missing (folded into a sheet, perhaps) and she does not plan to replace them. Good work, David and Rick!
Or she can recruit her granddaughter to conduct a little experiment....
This needs to get really complicated--what about a proportional hazards Cox analysis comparing the two arms?
I remember learning to use Welch's t-test in 10th grade Advanced Biology, and applying it to my science fair project that year, something with growth rates of yeast with two different acid supplements. I should have known then that I really should have gone into statistics instead of chemistry...
:-) Yes, I think I learned t-test and chi-square test in freshman biology. The chi-square test was for Mendel's experiement on peas in which he established the fundamental principals of genetics and inheritance. I guess that was my first exposure to pea-values.
I read this when it was posted, along with the Guest Post. What just occurred to me is that it is not the weight (mass) of the wet clothes, but the weight (mass) of water to be removed that should be considered. I will argue that the data collected cannot be used to answer the question posed.
You probably also need to calibrate the dampness sensor to be certain it signals 'Dry' consistently, and at the same level of dryness for differing materials and environmental (background) conditions.
Please tell your son that he helped me to save money with laundry time. In the past, I had always used 40 minutes for ALL of my drying cycles. After I learned from the award winning entry of young Mr. Wicklin's regression project, I now use much less time when the load is smaller. It worked. That was a lot of data to collect! Thanks for sharing.