I've conducted a lot of univariate analyses in SAS, yet I'm always surprised when the best way to carry out the analysis uses a SAS regression procedure. I always think, "This is a univariate analysis! Why am I using a regression procedure? Doesn't a regression require at least two variables?"
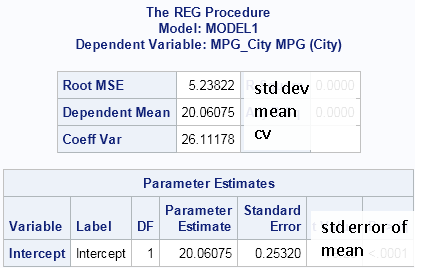
Then it dawns on me. In the SAS regression procedures, a MODEL statement that does not contain explanatory variables simply performs a univariate analysis on the response variable. For example, when there are no explanatory variables, a classical regression analysis produces sample statistics, such as the mean, the variance, and the standard error of the mean, as shown in the following output:
/* estimates of mean, variance, and std err of mean */ ods select FitStatistics ParameterEstimates ; proc reg data=sashelp.cars; model MPG_City= ; quit; |
The estimates in this PROC REG output are the same as are produced by the following call to PROC MEANS:
proc means data=sashelp.cars mean std stderr cv; var MPG_City; run; |
The ODS graphics that are produced by PROC REG also includes a histogram of the centered data and a normal Q-Q plot.
Here are some other instances in which a SAS regression procedure can be used to carry out a univariate analysis:
- Robust estimates of scale and location. This univariate analysis is usually performed by using PROC UNIVARIATE with the ROBUSTSCALE option. However, you can also use the ROBUSTREG procedure to estimate robust statistics. The ROBUSTREG procedure provides four different estimation methods, which you can control by using the METHOD= option. For example, the following statements display robust estimates of location and scale:
ods select ParameterEstimates;
proc robustreg data=sashelp.cars method=M;
   model MPG_City= ;
run;
-
Detection of univariate outliers. How can you detect univariate outliers in SAS? One way is to call the ROBUSTREG procedure! Again, there are four estimation methods that you can use.
ods select DiagSummary;
proc robustreg data=sashelp.cars method=LTS;
   model MPG_City= ;
   output out=out outlier=outliers;
run;

proc print data=out(where=(outliers=1));
   var make model type mpg_city;
run;
-
Estimation of quantiles, with confidence intervals. Last week I showed how to use PROC UNIVARIATE to compute sample quantiles and confidence intervals. An alternative approach is to use the QUANTREG procedure, as follows:
/* estimate univariate quantiles, CIs, and std errors */
ods output ParameterEstimates=QntlCI;
proc quantreg data=sashelp.cars;
   model MPG_City= / quantiles=0.025 0.2 0.8 0.975;
run;

proc print data=QntlCI; run;
- Fit discrete parametric models to univariate data. I've previously shown how to use the GENMOD procedure to fit a Poisson model to data, and the same technique can be used to fit other discrete distributions, including the binomial, geometric, multinomial, negative binomial, and some zero-inflated distributions.
- Fit parameters for a mixed density model to univariate data. I've previously demonstrated how to use the FMM procedure to fit a finite mixture distribution to data.
There are other examples, but I hope you see that the SAS regression procedures are useful for computing univariate statistics and analyses.
Do you have a favorite univariate analysis that can be accomplished by using a SAS regression procedure? Let me know about it by leaving a comment.

4 Comments
Intercept only models are commonly used in hierarchical linear modeling where they are referred to as unconditional means models using Proc Mixed (see Judith Singer's 1998 paper on Using Proc Mixed in SAS, a great intro to the topic).
My favorite surprising use of a PROC is actually sort of the reverse: using PROC CORR to do t-tests. When you correlate a binary variable with a continuous variable in PROC CORR (using the default Pearson correlations), you get the same P value as you would from an ordinary two-sample t-test. (This is dependent on the algorithm used to calculate the P value, as the exact distribution of the correlation coefficient is not t.) When I present this trick I am sometimes challenged by other statisticians who are horrified by this shortcut. But it's a handy, compact way to present a large number of t-tests for exploratory purposes.
Pingback: Winsorization: The good, the bad, and the ugly - The DO Loop
Pingback: Interpret estimates for a Weibull regression model in SAS - The DO Loop