Sometimes you want to label only certain observations in a plot. This is useful in many ways, but one use is to label outliers on a scatter plot.
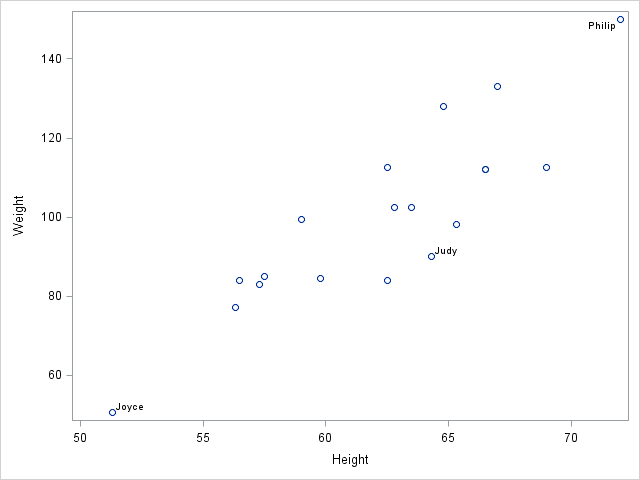
In the SGPLOT procedure, the DATALABEL= option enables you to specify the name of a variable that is used to label observations. For example, the following scatter plot shows the height versus the weight for all 19 children in the Sashelp.Class data set. The Name variable is used to label the observations:
proc sgplot data=Sashelp.Class; scatter x=Height y=Weight / datalabel=Name; run; |

Labeling only certain observations
For small data sets such as this one, you can label each observation without the labels colliding. For data sets with thousands of points, this is no long possible. Instead the convention is to label only unusual observations.
The trick is the use the fact that only nonmissing values for the DATALABEL= variable are plotted. Therefore, you can create a new variable called Label. The new variable is a copy of the Name variable, but it contains missing values for all but a handful of observations.
In the Sashelp.Class data, suppose you want to highlight the lightest student (Joyce), the heaviest student (Philip), and a student who has recently been sick (Judy). The following DATA step creates a new variable that contains the names of these three students, but otherwise contains a blank string, which is the SAS missing value for character variables:
data Class; set Sashelp.Class; Label = Name; if Name not in ("Joyce", "Judy", "Philip") then Label = " "; run; |
If you use the Label variable on the DATALABEL= option on the SCATTER statement, labels are shown only for the three students that you specified:
proc sgplot data=Class; scatter x=Height y=Weight / datalabel=Label; run; |
Label observations with numerical values
In the previous example, a character variable is used to label the observations. However, you can also use a numerical variable. All nonmissing values are displayed, so if you want to suppress labels for certain observations, set those label values to missing.
The following DATA step creates 1,000 observations from a bivariate normal distribution and computes the distance from each point to the origin. The goal is to label all points that are more than three units from the origin, so observations that are less than that distance are assigned a missing value for the dist variable. The dist variable is used as the DATALABEL= variable:
data a; call streaminit(12345); do i=1 to 1000; x = rand("Normal"); y = rand("Normal"); dist = euclid(x,y); if dist <= 3.0 then dist = .; output; end; run; proc sgplot data=a; scatter x=x y=y / datalabel = dist; /* label by distance */ run; |
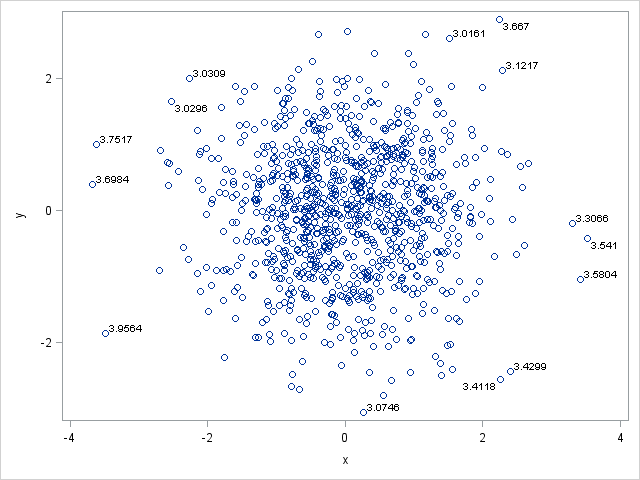
As you can see, each observation that is more than three units from the origin is labeled by its distance. The SGPLOT procedure automatically applies a default format to the dist variable (BEST6.?). You can specify your own format by using a FORMAT statement after the PROC SGPLOT statement. For example, if you want only to display the distance to one decimal point, specify format dist 3.1;

17 Comments
I like this solution!
Wow ... that's neat. The last one looks like a flower with petals coming off of it.
:-)
Pingback: The importance of measuring your business pain - The SAS Dummy
Thank you for your post. I added 'group=' option in hbar statement, the label disappeared. Is it a way this can be fixed?
Bar charts do not display or label individual observations. If you have general questions about PROC SGPLOT, you can ask them at the SAS Support Community for Graphics. Be sure to post the code and the version of SAS that you are running.
Thank you for your reply.
my scatterplot made using sgplot does not display all points
i'm unable to figure out a way to do this.
can we input parameters like start and end or something like that?
I suggest you post your data and the code that is not working to the SAS/GRAPH and ODS Graphics Community.
i cannot, it's confidential.
hence asking for help here
You don't have to post real data. You can make up fake data that shows the problem.
Pingback: Label markers in graphs by using the values of several variables - The DO Loop
I want to annotate the error bars with their +/- SE values, however datalabel option doesn't seem to be working and i get the below note.
NOTE: DATALABELPOS=DATA is not supported when bar limits are requested. The data labels will be positioned at the bottom.
The note explains why you do not see the labels at the top of the bars. If you want people to suggest alternatives, post your data and code to the Graphics Support Community.
Hi
that's a nice trick.
How can I manage this "Labeling only certain observations" with 2 series (PatientDays and Admissions) rather then one ?
proc sgplot data=noemers_acute_ZH_YR2;
series x=YEAR y=PatientDays / markers markerattrs=(color="#3AAA35" symbol=circlefilled) lineattrs=(color="#3AAA35" thickness=3) /*legendlabel="Standard Lab Value"*/;
series x=YEAR y=Admissions / markers markerattrs=(color="#B4CF00" symbol=squarefilled) lineattrs=(color="#B4CF00" thickness=3) Y2Axis/* legendlabel="New Device"*/;
xaxis label="Year" &styleaxis ;
yaxis label="Patient Days" grid values=(0 to 13000000) ;
y2axis label="Admissions" grid values=(0 to 18000000) ;
run;
Many thanks
Laura
Use two label variables. Use
DATALABEL=LabelVar1
for the first series and
DATALABEL=LabelVar2
for the second series.
Solved. Thank you Rick.
Another question : is it possible to give markers distrinct color for my labels selection ?
Many thanks
Laura
Yes. Since you seem to have many questions, I suggest you post to the SAS Support Communities. There is a graphical community.