In many procedures, the ID statement is used to identify observations by specifying an identifying variable, such as a name or a patient ID. In many regression procedures, you can specify multiple ID variables, and all variables are copied into output data sets that contain observation-wise statistics such as predicted values and residuals.
Values of an ID variable can also be used to label markers on a graph. For example, the following call to PROC REG models the weights of 19 students as a linear function of their heights. The PLOTS=COOKSD(LABEL) option requests a plot of Cook's D statistic, which gives information about observations that appear to have a large influence on the parameter estimates. The LABEL option requests that extreme values of the Cook's D statistic be labeled by using the ID variable. Let's see what happens if you specify two variables on the ID statement:
proc reg data=sashelp.class plots(only)=cooksd(label); model weight = height; id name age; /* specify TWO ID variables */ ods select CooksDPlot; quit; |
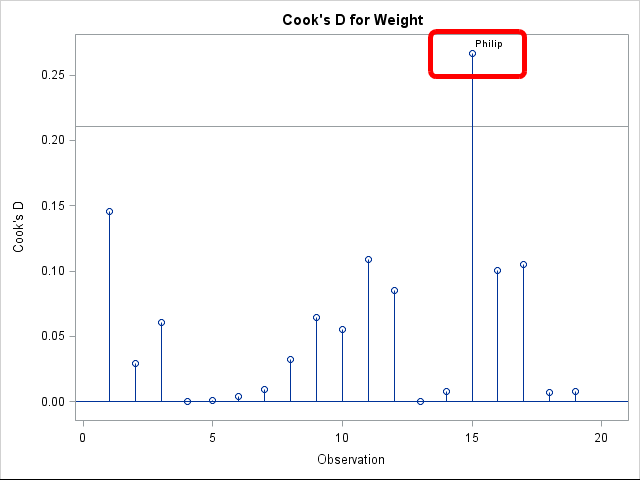
I've added a red rectangle that surrounds the labeled marker. Although two variables (NAME and AGE) were specified in the ID statement, the graph clearly shows that only the first variable (NAME) was used as a label. The documentation for the PLOTS= option tells us that this is the expected behavior: "If you specify one or more ID variables..., then the first ID variable [that]you specify is used for the labeling."
Most procedures exhibit a similar behavior, although a few (LOGISTIC, TRANSREG, ...) provide tooltips or other support for multiple ID variables.
For the procedures that support labeling by only one variable, there is an easy workaround: create a new ID variable by concatenating several other variables.
Concatenating multiple ID variables
You can use the concatenation operator (||) in the DATA step to concatenate two variables together. The following statements concatenate values of the NAME and AGE variables. The TRIM function can be used to remove trailing blanks from the NAME variable. In many cases, the DATA step will automatically convert the numeric AGE variable to a character value, but the following statements use the PUT function to explicitly convert a numeric variable to a character value prior to concatenation:
/* concatenate NAME and AGE to make new ID variable */ data class; set sashelp.class; length labl $12; /* NAME holds 8 characters. Allow for delimiter and age */ labl = trim(Name) || ": " || put(age, 2.); /* convert two-digit age to character */ run; proc reg data=class plots(only)=cooksd(label); model weight = height; id labl; /* label by using new variable */ ods select CooksDPlot; quit; |
With this change, each extreme point in the graph is labeled with the values of the NAME and AGE variables.
Labeling markers in ODS graphics
You can use the same trick to label a marker in a graph created by PROC SGPLOT. The canonical example is a scatter plot in which you want to label all observations. Because the DATALABEL= option supports only a single variable, you have to use concatenation if you want to see the values of multiple variables:
proc sgplot data=class; scatter x=height y=weight / datalabel = labl; run; |
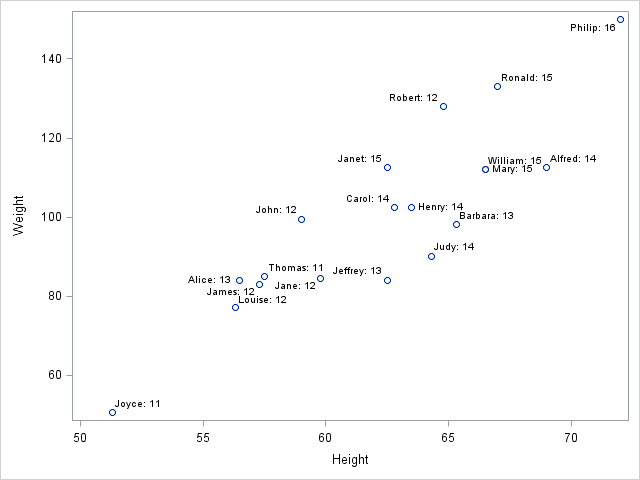
A drawback of the "concatenation technique" is that most graphs do not have room to display long labels for many points. The DATALABEL= option uses a collision-avoidance algorithm to avoid overplotting labels, but if you have hundreds or thousands of markers, it is best to use another mechanism for labeling markers.
One option to display multiple labels is to label only certain observations in the graph, such as observations that have extreme values. Another option, which works if you are going to examine the graph on your computer, is to use the TIP= option to create a tooltip for the scatter plot. With a tooltip, you can hover a pointer over a marker and view a pop-up window that displays the values of multiple variables.

1 Comment
Pingback: Create a map with PROC SGPLOT - The DO Loop