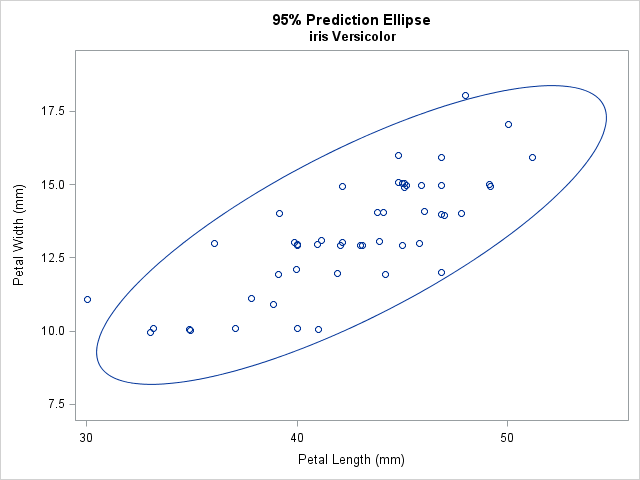
It is common in statistical graphics to overlay a prediction ellipse on a scatter plot. This article describes two easy ways to overlay prediction ellipses on a scatter plot by using SAS software. It also describes how to overlay multiple prediction ellipses for subpopulations. What is a prediction ellipse? A


