Suppose you create a scatter plot in SAS with PROC SGPLOT. What color does PROC SGPLOT use for the markers? If you specify the GROUP= option so that markers are colored by a grouping variable, what colors are used to represent the various groups? The following scatter plot shows the colors that are used by default for the HTMLBlue style. They are shades of blue, red, green, brown, and magenta.
data A; /* example data with groups 1, 2, ..., 5 */ do Color = 1 to 5; x = Color; y = Color; output; end; run; title "Marker Colors Used for GROUP= Option"; title2 "HTMLBlue Style"; proc sgplot data=A; xaxis grid; yaxis grid; scatter x=x y=y / group=Color markerattrs=(size=24 symbol=SquareFilled); run; |
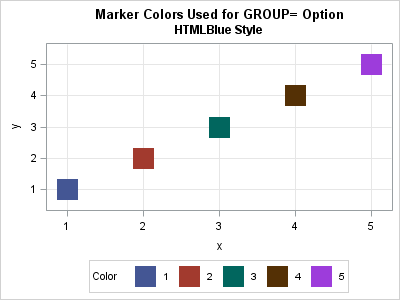
Notice that these marker colors are not fully saturated colors, so they are not the SAS color names RED, BLUE, GREEN, BROWN, and MAGENTA. So what colors are these? What are their RGB values?
What colors does PROC SGPLOT uses for groups? #SASTip Click To TweetColors come from styles
Colors are defined by styles, and you can use ODS style elements to set marker colors. A style defines elements called GraphDataDefault, GraphData1, GraphData2, GraphData3, and so forth. Each element contains several attributes such as colors and line patterns. The complete list of style elements and attributes for ODS graphics is in the documentation, but for this article, the important fact is that the GraphDatan:ContrastColor attribute determines the marker color for the nth group. These are the colors in the previous scatter plot.
Display an ODS style template
Styles are defined by ODS templates. You can use the SOURCE statement in PROC TEMPLATE to display a template. In the style template, the GraphDatan:ContrastColor attributes are set by using keywords named gcdata1, gcdata2, gcdata3, etc.
If you display the template for the styles.HTMLBlue template, you will see that the HTMLBlue style inherits from the Statistical style, and it is the Statistical style that defines the contrast colors. The following statements display the contents of the Statistical template to the SAS log:
proc template; source styles.statistical; quit; |
The template is long, and it is hard to scroll through the log to discover which colors are associated with each attribute. But that's no problem: you can use SAS to find and display only the information about contrast colors.
Display the marker colors as RGB and hexadecimal values
For years Warren Kuhfeld has been showing SAS customers how to view, edit, and use ODS templates to customize the graphs that are produced by SAS statistical procedures. A powerful technique that he uses is to write a template to a file and then use the DATA step to modify the template.
I will not modify the template but merely display information from it. The following DATA step writes the template to a text file and then uses the DATA step to find all instances of the keyword 'gcdata' in the template. For lines that contain the string 'gcdata', the program extracts the color for each keyword. The keyword-value pairs are saved to a data set, which is sorted and displayed:
libname temp "C:/temp"; proc template; source styles.statistical / file='temp.tmp'; /* write template to text file */ quit; data Colors; keep Num Name Color R G B; length Name Color $8; infile 'temp.tmp'; /* read from text file */ input; /* example string: 'gcdata1' = cx445694 */ k = find(_infile_,'gcdata','i'); /* if k=0 then string not found */ if k > 0 then do; /* Found line that contains 'gcdata' */ s = substr(_infile_, k); /* substring from 'gcdata' to end of line */ j = index(s, "'"); /* index of closing quote */ Name = substr(s, 1, j-1); /* keyword */ if j = 7 then Num = 0; /* string is 'gcdata' */ else /* extract number 1, 2, ... for strings */ Num = inputn(substr(s, 7, j-7), "best2."); /* gcdata1, gcdata2,... */ j = index(s, "="); /* index of equal sign */ Color = compress(substr(s, j+1)); /* color value for keyword */ R = inputn(substr(Color, 3, 2), "HEX2."); /* convert hex to RGB */ G = inputn(substr(Color, 5, 2), "HEX2."); B = inputn(substr(Color, 7, 2), "HEX2."); end; if k > 0; run; proc sort data=Colors; by Num; run; proc print data=Colors; var Name Color R G B; run; |
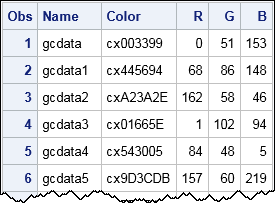
Success! The output shows the contrast colors for the HTMLBlue style. The 'gcdata' color is the fill color (a dark blue) for markers when no GROUP= option is specified. The 'gcdatan' colors are used for markers that are colored by group membership. Obviously you could use this same technique to display other style attributes, such as line patterns or bar colors ('gdata').
If you prefer a visual summary of the attributes for an ODS style, see section "ODS Style Comparisons" in the SAS/STAT documentation. That section is part of the chapter "Statistical Graphics Using ODS," which could have been titled "Everything you always wanted to know about ODS graphics but were afraid to ask."
An application of setting marker colors
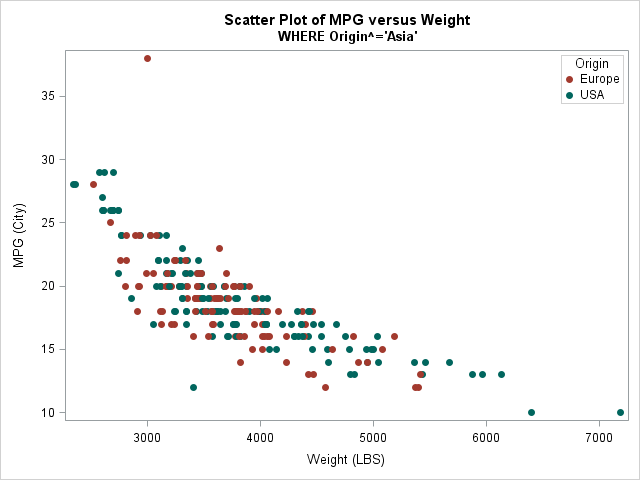
I prefer to style elements and discrete attribute maps to set colors for markers. But if you are rushed for time, you might want to use the STYLEATTRS statement to set the colors that are used for the GROUP= option. The STYLEATTRS statement requires a color list of hexadecimal colors or SAS color names. The following call to PROC SGPLOT uses the RGB/hex values for GraphData1:ContrastColor and so forth:
/* use colors for HTMLBlue style */ %let gcdata1 = cx445694; %let gcdata2 = cxA23A2E; %let gcdata3 = cx01665E; title "Origin in {Europe, USA}"; proc sgplot data=sashelp.cars; where origin^='Asia' && type^="Hybrid"; /* omit first category */ styleattrs DataContrastColors = (&gcdata2 &gcdata3); /* use 2nd and 3rd colors */ scatter x=weight y=mpg_city / group=Origin markerattrs=(symbol=CircleFilled); keylegend / location=inside position=TopRight across=1; run; |
It would be great if you could specify a style-independent syntax such as
styleattrs DataContrastColors=(GraphData2:ContrastColor GraphData3:ContrastColor); |
Unfortunately, that syntax is not supported. The STYLEATTRS statement requires a list of color values or SAS color names.
Although this trick is interesting, in general I prefer to use styles (rather than hard-coded color values) in production code. However, if you want to know the RGB/hex values for a style, this trick shows how you can get them from an ODS template.

1 Comment
Pingback: Tip for coding your color values in SAS Enterprise Guide - The SAS Dummy