Visualize a matrix in SAS by using a discrete heat map
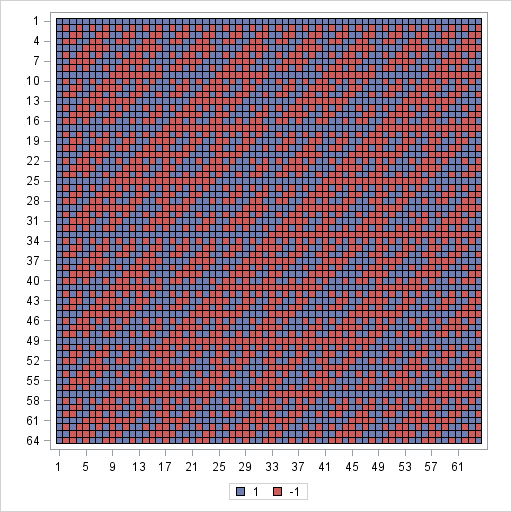
A heat map is a graphical representation of a matrix that uses colors to represent values in the matrix cells. Heat maps often reveal the structure of a matrix. There are three common applications of visualizing matrices with heat maps: Visualizing a correlation or covariance matrix reveals relationships between variables.

