In yesterday's post, I discussed a "quick and dirty" method to smooth periodic data. However, after I smoothed the data I remarked that the smoother itself was not exactly periodic. At the end points of the periodic interval, the smoother did not have equal slopes and the method does not guarantee that the predicted values are the same. The lack of periodicity occurs because of "edge effects" in the loess algorithm.
In this article I show how to correct these deficiencies to construct a truly periodic smoother. You can download the program used to construct the periodic loess smoother.
Creating a periodic smoother
The problem, as I discussed in my previous article, is that the loess algorithm behaves differently at the ends of the data range than in the middle. The loess algorithm uses the k observations nearest to x to predict a value at x. In the middle of the data, about k/2 points on either side of x are used to form a prediction at x. However, for observations near the minimum of the data, the algorithm uses about k points to the right of x. For observations near the maximum of the data, the loess algorithm uses about k points to the left of x. This asymmetry leads to the loess curve being aperiodic, even when the data are periodic.
A solution is to translate a copy of the data to the left and to the right before fitting the loess curve. By extending the data, an observation near the minimum of the data still has k/2 points to its right and k/2 points to its left. Furthermore, the points to the right are exactly the k/2 observations with the largest x values.
If you know ahead of time that you only need k/2 points to the left of the original data, you can just translate k/2 points. However, in the following DATA step I translate the entire set of data to the left and to the right. This simplifies the code and is sometimes necessary at the modeling stage of an analysis.
/* extend data to each side */ data Periodic; set TempData(in=before) TempData TempData(in=after); if before then proportion = proportion - 1; /* (-1,0] */ if after then proportion = proportion + 1; /* (1,2] */ run; |
I want to use 0.167 as the loess smoothing because that was the value used in my previous analysis.. But I need to be careful: I now have three times as much data, so I need to choose a smoothing parameter that is 1/3 smaller. In the following SAS statements, I create a data set to score the predicted values and I call PROC LOESS with the smoothing parameter 0.167 / 3 = 0.0557:
data Score; do proportion = 0 to 1 by 1/365; output; end; /* 3 times the data, so use 1/3 the smoothing parameter! */ proc loess data=Periodic plots(only maxpoints=none)=(FitPlot CriterionPlot); model Temperature = Proportion/ smooth=0.0557 interp=cubic; score data=Score; ods output ScoreResults=Fit; run; |
I can now plot the original data and overlay a truly periodic loess curve:
data Combine; merge TempData Fit(rename=(Proportion=Prop)); run; proc sgplot data=Combine; scatter x=Proportion y=Temperature / transparency=0.8; scatter x=Prop y=Temp / markerattrs=(color='gray' symbol=CircleFilled) legendlabel="Winter 2011-12"; series x=Prop y=P_Temperature/ lineattrs=(thickness=4px) legendlabel="Periodic smoother"; /* truly periodic */ yaxis grid; title "Temperature in Albany, NY (1995-2012)"; run; |
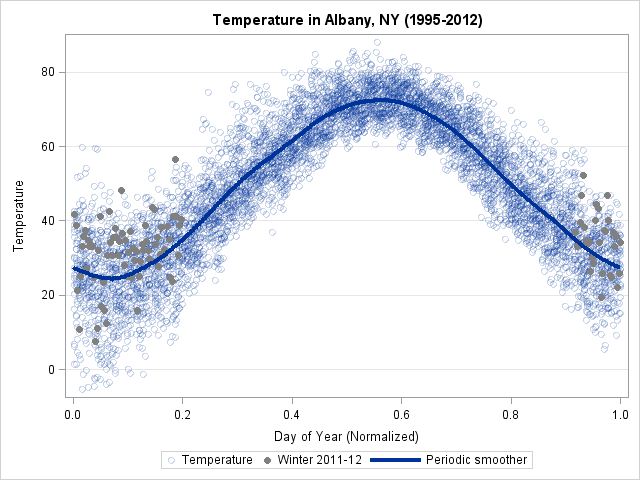
Notice that although the predicted values have not changed very much, the slopes of the loess curve at the ends of the data match up. The curve is a periodic smoother for these data. This method (extending the data in both directions) works for smoothers other than the loess smoother. As long as the smoother uses local interpolation, including spline interpolation, this technique should work.
The SAS/IML language has a built-in routine for fitting cubic splines to periodic data. The documentation gives examples of how to use it.
Do you have a favorite alternative method for smoothing periodic data? Leave a comment.

3 Comments
I'm not so savvy that I smooth periodic data. However, I do periodically enjoy a smoothie. And I enjoy it, more or loess.
Pingback: Simpler is better - Graphically Speaking
Pingback: Smoothers for periodic data - The DO Loop