Sometimes SAS programmers ask about how to analyze quantiles with SAS. Common questions include:
- How can I compute 95% confidence intervals for a median in SAS?
- How can I test whether the medians of two independent samples are significantly different?
- How can I repeat the previous analyses with other percentiles, such as the 20th percentile or the 90th percentile?
Historically, PROC UNIVARIATE and PROC NPAR1WAY are two procedures in SAS that analysts used for univariate analysis. PROC UNIVARIATE performs standard parametric tests. In contrast, PROC NPAR1WAY performs nonparametric tests and distribution-free analyses. An internet search reveals many resources that describe how to use UNIVARIATE and NPAR1WAY for analyzing quantiles.
However, there is an alternative way to analyze univariate quantiles: PROC QUANTREG. Although QUANTREG is designed for quantile regression, the same procedure can easily analyze quantiles of univariate data. All you need to do is omit the regressors from the right side of the MODEL statement and the procedure will analyze the "response" variable.
Be aware that the QUANTREG procedure uses an optimization algorithm to perform its analysis. This can sometimes result in different estimates than a traditional computation. For example, if the data set has an even number of observations and the middle values are a and b, one estimate for the median is the average of the two middle values (a+b)/2. The QUANTREG procedure might provide a different estimate, which could be any value in [a, b]. This difference is most noticeable in small samples. (Don't let this bother you too much. There are many definitions for quantile estimates. SAS supports five different definitions for calculating quantiles.)
Confidence intervals for percentiles
I have previously shown how to compute confidence intervals for percentiles in SAS by using PROC UNIVARIATE. The following statements compute the 20th, 50th, and 90th percentiles for the cholesterol levels of 5209 patients in a medical study, along with 95% confidence intervals for the quantiles. The computation is shown twice: first with PROC UNIVARIATE, then with PROC QUANTREG.
/* 1. Use PROC UNIVARIATE to get 95% CIs for 20th, 50th, and 90th pctls */ proc univariate data=Sashelp.Heart noprint; var Cholesterol; output out=pctl pctlpts=20 50 90 pctlpre=p cipctldf=(lowerpre=LCL upperpre=UCL); /* 12.1 options (SAS 9.3m2) */ run; data QUni; /* rearrange the statistics into a table */ set pctl; Quantile = 0.2; Estimate = p20; Lower = LCL20; Upper = UCL20; output; Quantile = 0.5; Estimate = p50; Lower = LCL50; Upper = UCL50; output; Quantile = 0.9; Estimate = p90; Lower = LCL90; Upper = UCL90; output; keep Quantile Estimate Lower Upper; run; title "UNIVARIATE Results"; proc print noobs; run; /**************************************/ /* 2. Alternative: Use PROC QUANTREG! */ ods select none; ods output ParameterEstimates=QReg ; proc quantreg data=Sashelp.Heart; model Cholesterol = / quantile=0.2 0.5 .9; run; ods select all; title "QUANTREG Results"; proc print noobs; var Quantile Estimate LowerCL UpperCL; run; |
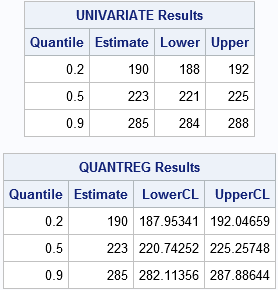
The output shows that the confidence intervals (CIs) for the quantiles are similar, although the QUANTREG intervals are slightly wider. Although UNIVARIATE can produce CIs for these data, the situation changes if you add a weight variable. The UNIVARIATE procedure supports estimates for weighted quantiles, but does not produce confidence intervals. However, the QUANTREG procedure can provide CIs even for a weighted analysis.
Test the difference of medians
In general, PROC QUANTREG can compute statistics for quantiles that UNIVARIATE cannot. For example, you can use the ESTIMATE statement in QUANTREG to get a confidence interval for the difference between medians in two independent samples. If the confidence interval does not contain 0, you can conclude that the medians are significantly different.
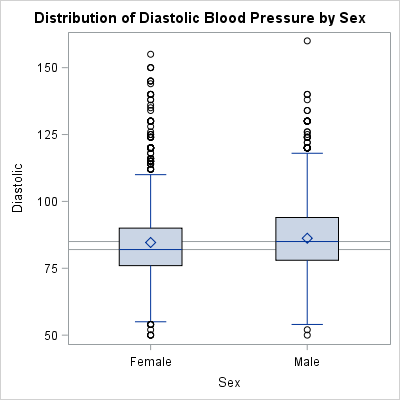
The adjacent box plot shows the distribution of diastolic blood pressure for male and female patients in a medical study. Reference lines are drawn at the median values for each gender. You might want to estimate the difference between medians in diastolic blood pressure for male and female patients and compute a confidence interval for the difference. The following call to PROC QUANTREG estimates those quantities:
ods select ParameterEstimates Estimates; proc quantreg data=Sashelp.Heart; class sex; model diastolic = sex / quantile=0.5; estimate 'Diff in Medians' sex 1 -1 / CL; run; |
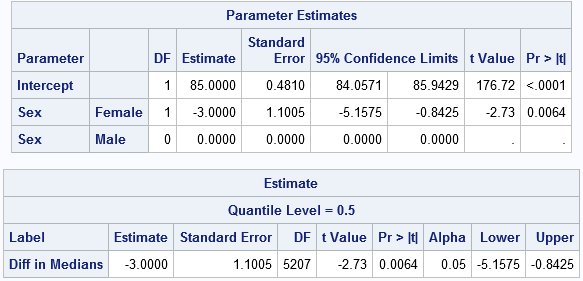
The syntax should look familiar to programmers who use PROC GLM to compare the means of groups. However, this computation compares medians of groups. The analysis indicates that female patients have a diastolic blood pressure that is 3 points lower than male patients. The 95% confidence interval for the difference does not include 0, therefore the difference is statistically significant. By changing the value of the QUANTILE= option, you can compare quantiles other than the median. No other SAS procedure provides that level of control over quantile estimation.
Conclusions
PROC QUANTREG provides another tool for the SAS programmer who needs to analyze quantiles. Although QUANTREG was written for quantile regression, the procedure can also analyze univariate samples. You can use the ESTIMATE statement to compare quantiles across groups and to obtain confidence intervals for the parameters.
In general, SAS regression procedures enable you to conduct univariate analyses that are not built into any univariate procedure.

8 Comments
Here's to anything that makes QUANTREG better known. I really think it should be used a lot more.
Traditionally you wanted to calculate the mean and the confidence intervals for the mean.
However since the median often is a better measure than the mean, we nowadays want to calculate:
the median and the confidence interval for the median.
My question: Is the confidence interval (CI) for the median smaller or bigger than that of the mean?
Or is it not possible to say anything about this in general?!
(My guess is that the CI for the median, for almost symmetric distributions, is smaller than the CI of the mean.
However I can NOT prove it). / Br Anders Ph.D., Actuary, SAS user since 1981, now retired (mostly)
My answer is that "it is not possible to say anything about this in general". For example,
1. Given a sample from the normal distribution, its variance of sample median is about 1.57 times the variance of the sample mean.
2. Given a sample from the Cauchy distribution, its sample mean does not mean anything because the distribution mean does not exist at all. But you can use the sample median to estimate the distribution median, and the variance of the sample median also exists.
The variance of an iid-sample median equals 1/(4nf(m)*f(m)), where f() is the probability density function of the relevant response, m is the true response median, n is the size of the sample. (iid means independent and identically distributed.)
Pingback: Quantiles and the Flint water crisis - The DO Loop
Thanks for the nice article. I have a small issue with the phrase "median difference". As far as I have seen, median difference is generally referred to be the median of all possible differences for which Hodges-Lehmann is an estimator. On the other hand, the subject of this article is related to difference in(between) medians which is very different and not related to Hodges-Lehmann. A clarification on this would be illuminating.
Thanks for writing. You say "the subject of this article is related to difference in(between) medians which is .. not related to Hodges-Lehmann." That is correct. I hope that the title of this article and the first paragraph makes that clear.
This procedure calculates the 'median difference / difference of medians' and NOT the 'difference in medians'. Is that correct?
Thanks for writing. When I hear "difference in medians" I think of paired data. For paired data, you can compute the difference D[i] = x[i]-y[i] and report the median of the differences. This article does not consider that scenario. This article assumes that there are two groups, possibly from different distributions. It tests whether the median of the distribution for the first group is significantly different from the median of the distribution of the second group.