The FREQ procedure in SAS supports computing exact p-values for many statistical tests. For small and mid-sized problems, the procedure runs very quickly. However, even though PROC FREQ uses efficient methods to avoid unnecessary computations, the computational time required by exact tests might be prohibitively expensive for certain tables. If so, you can use a Monte Carlo approach to randomly generate tables that satisfy the null hypothesis for the test and evaluate the test statistic on those tables.
This article shows how to generate Monte Carlo estimates for exact tests in SAS. For many tests, you can use the EXACT statement in PROC FREQ, which supports the MC option for computing Monte Carlo estimates. You can also use SAS/IML to simulate many random contingency tables, compute the statistic on each table, and thereby approximate the sampling distribution of the test statistic.
An example of an exact chi-square test in SAS
Let's see how an exact test works for a familiar test like the (Pearson) chi-square test for independence of rows and columns.
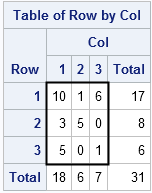
The adjacent 3 x 3 table (the nine number inside the heavy rectangle) appears in Agresti, Wackerly, and Boyett (1979). If you run a chi-square test in PROC FREQ, the value of the chi-square statistic as 14.81 and the p-value of 0.0051. However, most of the cells in this table have small counts. Consequently, the procedure will also issue a warning: "WARNING: 89% of the cells have expected counts less than 5. (Asymptotic) Chi-Square may not be a valid test." This is a classic example that calls for an exact test, which you can compute by using the EXACT statement, as follows:
proc freq data=TestTable; weight Count; table Row*Col / norow nocol nopct; exact pchi; /* run an exact chi-square test */ run; |
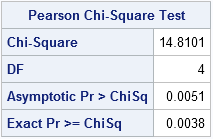
The output tells you that the exact p-value is 0.0038. Therefore you would reject (at the 0.05 significance level) the null hypothesis that the rows and columns are independent.
Monte Carlo estimates of p-values by using PROC FREQ
The exact test finishes almost instantly because the table is small, both in terms of sample size (N=31) and in terms of dimensions (3 x 3). Monte Carlo sampling (simulation) enables you to handle bigger samples and dimensions. It is easy to get Monte Carlo estimates from PROC FREQ: you merely add the MC option in the EXACT statement, as follows:
proc freq data=TestTable; weight Count; table Row*Col / norow nocol nopct; exact pchi / MC; /* request Monte Carlo estimate */ run; |
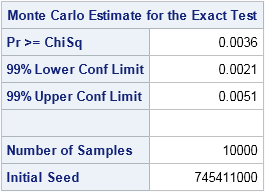
Because I did not provide a random number seed, the Monte Carlo simulation is seeded by the time of day, which means that you will get a different answer each time you run the program. By default, the EXACT statement generates 10,000 random tables that have the same row and column sum as the observed table. It evaluates the chi-square statistic on each table and counts how many statistics have a value equal to or more extreme than the observed values. For this simulation, 36 of the 10,000 random tables satisfied the condition. The proportion of extreme statistics (0.0036) is the Monte Carlo estimate for the p-value of the test. For more precise estimates, you can use the N= suboption to increase the number of samples for the Monte Carlo simulation.
Run the Monte Carlo simulation yourself
As I wrote last week, you can use the SAS/IML language to implement an algorithm that simulates contingency tables from the null distribution, which assumes no association between the row variable and the column variable. Let's see how you can use that algorithm to implement your own Monte Carlo estimate for the chi-square statistic.
You can download the Monte Carlo program, which has the following parts:- Compute the chi-square statistic on the observed table.
- Simulate 10,000 random tables from the null distribution and evaluate the test statistic on each.
- Compute the p-value as the proportion of statistics that are at least as extreme as the observed statistic.
- Optionally, compute a Wald confidence interval for the p-value.
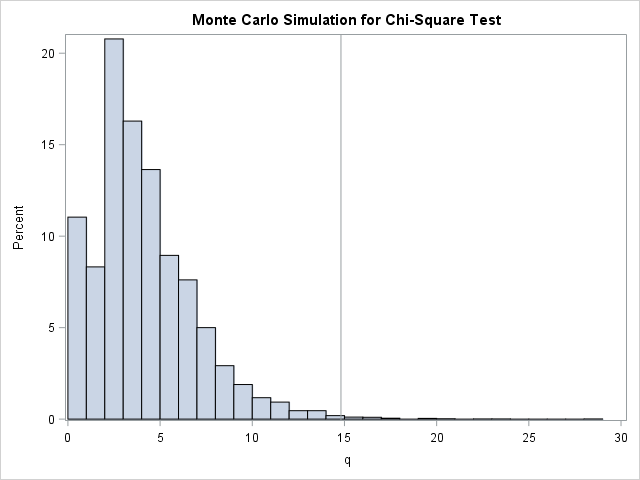
- Optionally, create a histogram of the 10,000 statistics, which visualizes the approximate sampling distribution. Mark the value of the observed statistic.
The first step is to define the observed table and compute the test statistic on that table:
proc iml;
load module=(RandContingency);
T = {10 1 6,
      3 5 0,
      5 0 1};
c = T[+, ];  r = T[ ,+];

/* 1. Compute the chi-square statistic on the observed table. */
E = r*c / c[+];         /* expected under null model of independence */
q0 = sum((T-E)##2 / E); /* observed chi-square statistic */
print q0; |
The printed value is 14.81, which agrees with the output from PROC FREQ.
The following module implements the second step. The module simulates tables from the null distribution and computes the chi-square statistic on each. A column vector of statistics is returned.
/* 2. Simulate tables from null distribution; evaluate test statistic on each. */
start MCChiSq(tbl, NRep);
   c = tbl[+, ];
   r = tbl[ ,+];
   E = r*c / c[+];   /* expected under null model of independence */
   q = j(NRep,1);
   do i = 1 to nRep;
      A = RandContingency(c, r); /* sample from null distribution */
      q[i] = sum((A-E)##2 / E);  /* evaluate test statistic */
   end;
   return( q );
finish;

call randseed(54321);
q = MCChiSq(T, 10000); /* simulate 10,000 tables */ |
After you have computed the statistics, the rest is easy. The following function computes the usual estimate and confidence interval for a binomial proportion:
/* 3 & 4. Compute the p-value and confidence interval */
/* Let x be binary 0/1 vector. Compute estimate for proportion. Use asymptotic
   standard error to construct two-sided Wald confidence interval. For a Monte Carlo
   estimate, the standard error has N-1 in the denominator. */
start BinomialCI(x, alpha=0.05);
   p = mean(x);                       /* estimate proportion of 1s */
   se = sqrt(p*(1-p) / (nrow(x)-1));  /* standard error for MC estimate */
   z = quantile("Normal", 1-alpha/2); /* two-sided */
   LowerCL = p - z*se;
   UpperCL = p + z*se;
   return( p || max(LowerCL, 0) || min(UpperCL, 1) );   /* CL for proportion is in [0,1] */
finish;

x = (q>=q0);                    /* binary vector */
est = BinomialCI(x, 0.01);      /* compute 99% CL to match PROC FREQ */
print est[L="Binomial 99% CI" c={"Est" "LowerCL" "UpperCL"}]; |
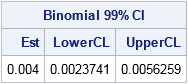
For this simulation, 40 of the 10,000 random tables had a value of the test statistic that was at least as extreme as the observed table. The estimate (0.004) and the 99% confidence limits are consistent with the Monte Carlo estimates from PROC FREQ.
Lastly, you might want to use your Monte Carlo computations to visualize the approximate sampling distribution for the statistic. You can create a histogram of the 10,000 statistics and mark the location of the observed test statistic by using a reference line:
/* 5. Optionally, create a histogram and mark the observed statistic. */ reflineStmt = "refline " + char(q0) + " / axis=x;"; call Histogram(q) other=reflineStmt; |
The last two steps demonstrate techniques that are useful in other situations. For example, you can use them to visualize a bootstrap distribution and to estimate p-values for permutation tests and other resampling methods.

6 Comments
Hello Dr. Rick,
Thank you for your explanation in how to run the Monte Carlo simulation with contingency table in SAS.
I have a question about the SAS output from using the exact statement with MC with the PROC FREQ procedure. Instead of one, I have three different result tables of Monte Carlo Estimate for the Exact test, each one of them has the same sample size (e.g. 10000) but different initial seeds. Is there a rule in choosing the P-value from the three result tables? Hope you can help with my confusion.
Thanks,
Shaoqi Fan
The answer is that it doesn't matter which one you report. They are all equally valid (or invalid).
It is possible to lie with a simulation. You are using the Monte Carlo estimates to get a handle on the sampling variability, but the fact is that Monte Carlo estimators also have variance. The best advice I can give is to choose the number of MC simulations large enough so that the variance of the MC estimator is an order of magnitude smaller than the standard error of the statistic you are measuring. If that is too hard, then increase the number of MC iterations by 4, which will double the accuracy of the estimates, and see if the results change or essentially stay the same.
Hello Dr. Rick,
I want to run a Monte Carlo simulation VERY similar to this one, for the chi-square goodness of fit test. There are six categories with null probabilities 30,20,20,10,10,10 respectively. I want to compute the p-value of the simulation and compare it to the p-value of the observed statistic. How can I run this? Thanks!!
This sounds like a one-way table. Simulate from the null by using the Table distribution. Write all of the (10,000 or so) samples to a single SAS data set, where each sample is identified by the value of an ID indicator variable. Then call PROC FREQ with a BY ID statement and use the TESTP=(30 20 ... 10) option on the TABLES statement.
Dear Dr. Wicklin,
If we run a chi-square test (or any other test) chosing a Monte Carlo simulation or the exact method, how can we report the results of the test? I mean should we still report the X² value and the degrees of freedom or these are relevant only if we select the asymptotic method and then reporting the Monte Carlo/exact p value is enough?
Thank you very much!
Different journals might have different requirements, but I'd start with the following:
For the exact method, report that you used PROC FREQ in SAS to run an exact test for the chi-square test of independence and that the (exact) p-value was XYZ. Yes, the chi-square and DF values are relevant to the exact test.
For the Monte Carlo option, report the seed value and the number of MC simulations along with the empirical p-value from the simulation.