In my book Simulating Data with SAS, I specify how to generate lognormal data with a shape and scale parameter. The method is simple: you use the RAND function to generate X ~ N(μ, σ), then compute Y = exp(X). The random variable Y is lognormally distributed with parameters μ and σ. This is the standard definition, but notice that the parameters are specified as the mean and standard deviation of X = log(Y).
Recently, a SAS customer asked me an interesting question. What if you know the mean and variance of Y, rather than log(Y)? Can you still simulate lognormal data from a distribution with that mean and variance?
Mathematically, the situation is that if m and v are the mean and variance, respectively, of a lognormally distributed variable Y, can you compute the usual parameters for log(Y)? The answer is yes. In terms of μ and σ, the mean of Y is m = exp(μ + σ2/2) and the variance is v = (exp(σ2) -1) exp(2μ + σ2). You can invert these formulas to get μ and σ as functions of m and v. Wikipedia includes these formulas in its article on the lognormal distribution, as follows:
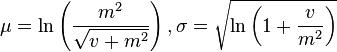
Let's rewrite the expression inside the logarithm. If you let φ = sqrt(v + m2), then the formulas are more simply written as
μ = ln(m2 / φ), σ2 = ln(φ2 / m2 )
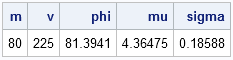
Consequently, you can specify the mean and the variance of the lognormal distribution of Y and derive the corresponding (usual) parameters for the underlying normal distribution of log(Y), as follows:
data convert; m = 80; v = 225; /* mean and variance of Y */ phi = sqrt(v + m**2); mu = log(m**2/phi); /* mean of log(Y) */ sigma = sqrt(log(phi**2/m**2)); /* std dev of log(Y) */ run; proc print noobs; run; |
For completeness, let's simulate data from a lognormal distribution with a mean of 80 and a variance of 225 (that is, a standard deviation of 15). The previous computation enables you to find the parameters for the underlying normal distribution (μ and σ) and then exponentiate the simulated data:
data lognormal; call streaminit(1); keep x y; m = 80; v = 225; /* specify mean and variance of Y */ phi = sqrt(v + m**2); mu = log(m**2/phi); sigma = sqrt(log(phi**2/m**2)); do i = 1 to 100000; x = rand('Normal', mu, sigma); y = exp(x); output; end; run; |
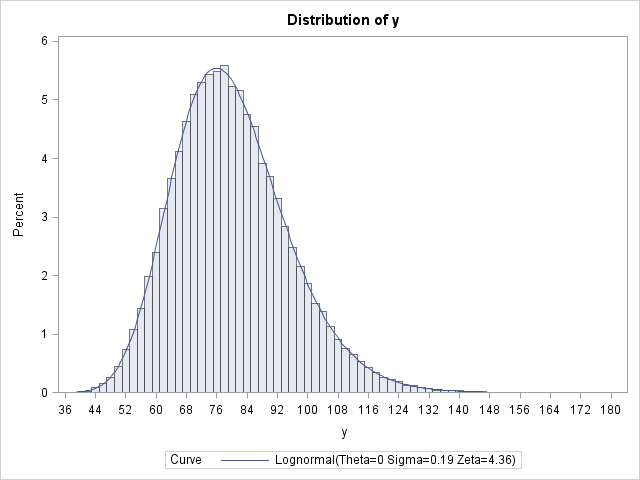
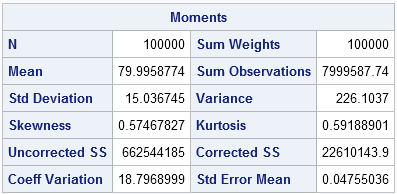
You can use the UNIVARIATE procedure to verify that the program was implemented correctly. The simulated data should have a sample mean that is close to 80 and a sample standard deviation that is close to 15. Furthermore, the LOGNORMAL option on the HISTOGRAM statement enables you to fit a lognormal distribution to the data. The fit should be good and the parameter estimates should be close to the parameter values μ = 4.36475 and σ = 0.18588 (except that PROC UNIVARIATE uses the Greek letter zeta instead of mu):
ods select Moments Histogram ParameterEstimates; proc univariate data=lognormal; var y; histogram y / lognormal(zeta=EST sigma=EST); run; |
The histogram with fitted lognormal curve is shown at the top of this article. The mean of the simulated data is very close to 80 and the sample standard deviation is close to 15.
My thanks to the SAS customer who asked this question—and researched most of the solution! It is a question that I had not previously considered.
Is this a good way to simulate lognormal data? It depends. If you have data and you want to simulate lognormal data that "looks just like it," I suggest that you run PROC UNIVARIATE on the real data and produce the maximum likelihood parameter estimates for the lognormal parameters μ and σ. You can then use those MLE estimates to simulate more data. However, sometimes the original data is not available. You might have only summary statistics that appear in some journal or textbook. In that case the approach in this article enables you to map the descriptive statistics of the original data to the lognormal parameters μ and σ so that you can simulate the unavailable data.

21 Comments
Pingback: Geometry, sensitivity, and parameters of the lognormal distribution - The DO Loop
Hi Rick,
Is it possible to generate a matrix of random numbers using lognormal distribution with a specific mean and variance directly without using normal distribution as you did in the above program? How we can do that?
I appreciate yoyr help.
Best Regards, Amany
In the DATA step, you can directly generate standardized lognormal data by using x=RAND("lognormal"). This call uses a location parameter of 0 and a shape parameter of 1. You can override the default parameter values to generate lognormal data from a two-parameter family. For example, x=RAND("lognormal", 2, 3) uses a location parameter of 2 and a shape parameter of 3.
I want to generate a matrix 5*5 from lognormal dist. with a specified values of mean and sigma, thus I wrote the folloowing program:
proc iml;
mu=1;
sigma=0.04996;/*sigma value*/
n = 5; m = 5;
x2 = j(n,m);
call randseed (12345);
x2 = j(n,m); /* allocate (n x m) matrix*/
call randgen(x2,'LOGN', mu, sigma);
print x2;
quit;
run;
However, I got the following message in the log. I do not know what is wrong!!
call randgen(x2,'LOGN', mu, sigma);
ERROR: (execution) Incorrect number of arguments.
I appreciate your help.
Amany
Yes, that is the correct syntax for modern versions of SAS. The ability to specify default parameters for lognormal was added in IML 12.1 (SAS 9.3m2), which shipped in 2012. You must be using an older version of SAS.
Thank you
Hello Rick,
I generated data from Weibull dist. (a,b) for 1000 times using do loop and the MLEs were calculated for each group of data as it is shown in SAS help.
The run was done but I got the following warnings and notes:
WARNING: Finishing a module while inside a DO group.
NOTE: Module F_WEIB2 defined.
WARNING: Finishing a module while inside a DO group.
NOTE: Module G_WEIB2 defined.
Does it mean that there is something wrong?
Is it allowed to use the modules for calculating MLEs of Weibull dist. inside do loop?
I appreciate your help,
Best Regards.
You can ask programming questions at the SAS Support Community for SAS/IML. Include your program and any data. For error and warning messages, include the SAS log.
Thank you for your help. I have a general question,
In case that I get warnings in the the log when a program is run, does it mean that there is a mistake in the executed program? what should I do if this hppens?
Thank you.
Dear Rick,
thank you for this post.
I am currently working on my master thesis in Epidemiology. I want to simulate data, which closely resembles my real-world example. For that I chose the approach you mentioned above.
In your book "Simulating Data with SAS", the distribution table for the rand() function shows that it is possible to specify shape and scale parameters for lognormal and gamma distributions. The SAS help indicates that it is only possible to specify the shape and not scale. When entering both parameters into the rand(parm1, parm2) function, I receive an error: " One parameter must be specified with the RAND function and the gamma distribution.".
Is there a way around this? I would like to stick with the rand() function as suggest generally by you, and not go back to the rangam()/rannor() routines.
Thank you very much!
With kind regards,
Tim
It appears that some documentation did not get updated. Thank you for bringing that to my attention.
If you do not have support for the two-parameter Gamma distribution, you must be running an old version of SAS. You should mention this to your system administrators and encourage them to upgrade to SAS 9.4.
On p. 110, I show how to add location and scale parameters to distributions that do not support them. The Gamma and Lognormal families are included in that discussion.
Thank you very much for the quick reply, I appreciate it!
zk is a log-normal random variable with zero mean and standard deviation = 8. zk=?
Thank pro!
zk does not have a value. It is a random variable, which means that it has a probability of becoming a value. For example, it has a 68% chance of being between the values exp(-8) and exp(8). Its most likely value is 1.
Hello,
To complete the question from Tran Quang Thi, I wonder what are the parameters mu and sigma knowing that m = 0. In this case, using the formula for mu we have a log(0) which is undefined... ?
Your question doesn't make sense. The mean of a lognormally distributed variable, Y, is always greater than zero because Y = exp(X), where X is normally distributed. The range of the exponential function is Y > 0.
Hi Rick
Just wondered if below can be done in Excel?
x = rand('Normal', mu, sigma)
I am trying to generate a lognormal distribution for initial gas flow rate with known mean and SD and unknown data set and am not very familiar with other tools.
Thanks,
Ali
Thank you, thank you, thank you!
Hello guys,
I'm looking for someone who can give me a possible code for this exercice?
Thanks in advance
The following observations are data from four mutuals funds. The data is delimited by spaces between the variables:
...
You can ask SAS programming questions at the SAS Support Communities.
Pingback: Simulate the use of personal checks in the US - The DO Loop