If you've ever tried to use PROC FREQ to create a frequency table of two character variables, you know that by default the categories for each variable are displayed in alphabetical order. A different order is sometimes more useful. For example, consider the following two-way table for the smoking status and weight status of 5,167 patients in a medical study, as recorded in the Sashelp.Heart data set, which is distributed with SAS software:
proc freq data=sashelp.heart; tables Smoking_Status*Weight_Status / norow nocol nopct; run; |
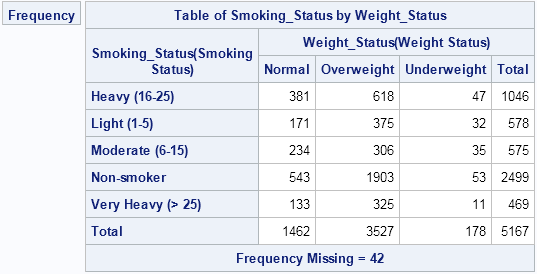
The alphabetical order of the categories is not the best choice for these data. A better table would order the weight categories as "Underweight," "Normal," and "Overweight." Similarly, the smoking categories should be ordered from 'Non-smoker' to "Very Heavy (> 25)."
In most introductory SAS courses—and at almost every SAS conference—you will hear recommendations about how to encode ordinal variables when you create a SAS data set. Two common ways to make specify the order of categories are:
- Create (or sort) the data in the order that you want the frequency table to appear. Use the ORDER=DATA option on the PROC FREQ statement to instruct the procedure that it should order categories as they appear in the data set.
- Encode the data as a numerical variable with values 1, 2, 3, ..., and use a SAS format to provide the text that will be displayed for each category. The FREQ procedure will order the (numerical) variables by 1, 2, 3, ..., but will display the formatted values as the headers for the frequency tables.
The first approach is simple, but it has limitations. Often the data set is handed to you; you don't get to create it. You can use PROC SORT to create a sorted copy of the data, but you still need to provide variables with values such as 1, 2, 3, ..., in order to sort the data. Furthermore, if some joint categories are empty (for example, there are no underweight non-smokers in the data), then the ORDER=DATA option might not accomplish what you want. (However, a workaround is to create a weight variable and using the ZEROS option in the WEIGHT statement to include empty levels.)
The second approach requires that you add sorting variables to the data set and apply a format to those variables. First, define the format:
proc format; value WtFmt 1 = 'Underweight' 2 = 'Normal' 3 = 'Overweight'; value SmFmt 1 = 'Non-smoker' 2 = 'Light (1-5)' 3 = 'Moderate (6-15)' 4 = 'Heavy (16-25)' 5 = 'Very Heavy (> 25)'; run; |
Next, create new sorting variables and apply the formats to "recreate" the original variables:
data Heart / view=Heart; format Smoking_Cat SmFmt. Weight_Cat WtFmt.; set sashelp.heart; select (Weight_Status); when ('Underweight') Weight_Cat=1; when ('Normal') Weight_Cat=2; when ('Overweight') Weight_Cat=3; when (' ') Weight_Cat=.; end; select (Smoking_Status); when ('Non-smoker') Smoking_Cat=1; when ('Light (1-5)') Smoking_Cat=2; when ('Moderate (6-15)') Smoking_Cat=3; when ('Heavy (16-25)') Smoking_Cat=4; when ('Very Heavy (> 25)') Smoking_Cat=5; when (' ') Smoking_Cat=.; end; run; |
I have created a data set view rather than a data set in order to save storage space, which might be important for large data sets. You can now call PROC FREQ, as follows:
proc freq data=heart; tables Smoking_Cat*Weight_Cat / norow nocol nopct; run; |
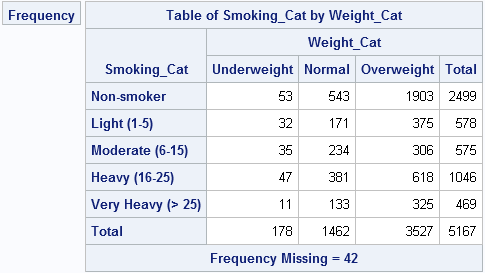
By using this technique, you can specify any order for the categories of a contingency table. The technique extends to other analyses as well.
For more on using PROC FORMAT for data analysis, see the following articles:
- Specify the colors of groups in SAS statistical graphics by using data attributes. [Note: In SAS 9.4, an alternative is to use the STYLEATTRS statement to set the style attributes for groups for a single call to the SGPLOT procedure.]
- Count the number of missing values for each variable.

12 Comments
These are two good methods. I sometimes use a third method. I simply relabel the variables. So, in the example above, e.g.
data new;
set sashelp.heart;
if weight = 'Underweight' then weight = "A: Underweight";
else if weight = 'Normal' then weight = "B: Normal";
else if weight = 'Overweight' then weight = "C: Overweight";
else weight = weight;
run;
(and similarly for smoking).
Or, if I don't want to change the original variable, I just create weight2 and use that.
Is there anything problematic about this approach?
Peter
Pingback: Create mosaic plots in SAS by using PROC FREQ - The DO Loop
can i know what is the advantage and disadvantage by using proc freq??
Advantage: Fast, flexible, powerful, includes statistical tests such as chi-square & Fisher's exact, extensive documentation, huge base of users who know how to use the procedure, technical support, built-in graphics
Disadvantages: I can't think of any. Maybe "the procedure is so comprehensive that it is hard to learn all that it can do."
What if one needs the rows to be ordered by frequency and the columns to be ordered alphabetically? Since frequency is contingent on the data, I can't define that sorting ahead of time. On the other hand, if I use the order=freq option on the table, both rows and columns are ordered by frequency. Is it possible to use different order options on different variables in the same table? Thanks in advance for any suggestions anyone can offer.
Use the default order in PROC FREQ, which is alphabetical. Then write the table to a SAS data set and sort the rows by total frequency.
Thanks for the suggestion. Is ODS required to get the right form of the table into a SAS data set? Because when I use the out= option on the table statement of proc freq, the resulting SAS data set does not look like the table. Instead of having a separate column for each year as the table does, the resulting data set has a single year variable as the original data set did. Is transposing required to get the individual years back into separate columns?
If you need help with PROC FREQ syntax, you can post your data and code to the SAS Support Communities.
Will do. Thanks again.
Pingback: The SELECT statement in the SAS DATA step - The DO Loop
Pingback: Create heat maps with PROC SGPLOT - The DO Loop
Pingback: Use SAS formats to bin numerical variables - The DO Loop