PROC UNIVARIATE has provided confidence intervals for standard percentiles (quartiles) for eons. However, in SAS 9.3M2 (featuring the 12.1 analytical procedures) you can use a new feature in PROC UNIVARIATE to compute confidence intervals for a specified list of percentiles.
To be clear, percentiles and quantiles are essentially the same thing. For example, the median value of a set of data is the 0.5 quantile, which is also the 50th percentile. In general, the pth quantile is the (100 p)th percentile.
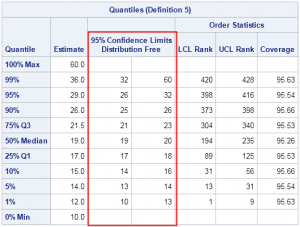
The CIPCTLDF option on the PROC UNIVARIATE statement produces distribution-free confidence intervals for the 1st, 5th, 10th, 25th, 50th, 75th, 90th, 95th, and 99th percentiles as shown in the following example:
/* CI for standard percentiles: 1, 5, 10, 25, 50, 75, 90, 95, 99 */ ods select Quantiles; proc univariate data=Sashelp.Cars cipctldf; var MPG_City; run; |
However, prior to the 12.1 releaase of the analytics procedures, there was not an easy way to obtain confidence intervals for arbitrary percentiles. (Recall that you can specify by nonstandard percentiles by using the PCTLPTS= option on the OUTPUT statement.)
I am happy to report that the OUTPUT statement in the UNIVARIATE procedure now supports the CIPCTLDF= option, which you can use as follows:
proc univariate data=sashelp.cars noprint; var MPG_City; output out=pctl pctlpts=2.5 20 80 97.5 pctlpre=p cipctldf=(lowerpre=LCL upperpre=UCL); /* 12.1 options (SAS 9.3m2) */ run; proc print noobs; run; |
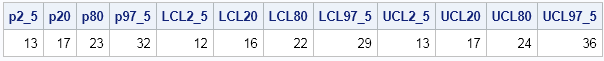
The CIPCTLDF= option computes distribution-free confidence intervals for the percentiles that are specified on the PCTLPTS= option. The LOWERPRE= option specifies the prefix to use for lower confidence limits; the UPPERPRE= option specifies the prefix to use for upper confidence limits.
If your data are normally distributed, you can use the CIPCTLNORMAL= option on the OUTPUT statement to compute confidence limits. However, if your data are not normally distributed, the CIPCTLNORMAL= option might produce inaccurate results. For example, on the MPG_City data, which is highly skewed, the confidence intervals for large percentiles (like the 99th percentile) do not contain the corresponding point estimate. For this reason, I prefer the distribution-free intervals for most analyses.

12 Comments
Neat! Thanks for sharing this...
Pingback: Use regression for a univariate analysis? Yes! - The DO Loop
In using PROC QUANTreg the output includes "95% confidence limits" for the parameter estimates. Could you explain what this is, and how to use it in reporting results?
Thanks!
P.S. Excerpt from SAS code:
proc QUANTreg ci=sparsity/iid algorithm=interior(tolerance=1.e-4)
data=SASUSER.bb2014oct;
where age eq 60;
model PUTRL =
pipopera ann_ppt /
quantile=0.2 0.4 0.6 0.8
plot=quantplot;
run;
A 95% confidence interval (CI) accounts for the fact that the sample is a random draw from a population. If you were to take additional samples of the same size and rerun the analysis, you would get slightly different parameter estimates. However, 95% of the time your parameter estimates will be within the upper and lower confidence limits. For more about CIs, see the article "Regression coefficient plots in SAS."
Pingback: The smooth bootstrap method in SAS - The DO Loop
Pingback: Quantile estimates and the difference of medians in SAS - The DO Loop
A really great and useful article. Is there a simple way to calculate the 95% CI for the mode of a given data set?
I'm working on a survey related exercise, trying to match the output of a survey (300 responses) to the output of an assessment (1 response). if the assessment response to a specific question is within the 95%CI for the mode, I'd like to say that there is no difference between the two.
Any thoughts on this.
You want a CI for the mode of a continuous unimodal distribution? Sorry, but I am not familiar with any result like that. Even estimating the mode from data is hard unless you assume a parametric form of the underlying distribution. (Of course, for a symmetric distribution, mean=mode so you can solve that problem.)
Pingback: Quantiles and the Flint water crisis - The DO Loop
Pingback: Sample quantiles: A comparison of 9 definitions - The DO Loop
What is the formula that is used for Order Statistics LCL and UCL Rank?
I provide a link to the PROC UNIVARIATE documentation. The formula is in the Details chapter, "Calculating Percentiles" section.