Sometimes it is useful to group observations based on the values of some variable. Common schemes for grouping include binning and using quantiles.
In the binning approach, a variable is divided into k equal intervals, called bins, and each observation is assigned to a bin. In this scheme, the size of the groups is proportional to the density of the grouping variable. In the SAS/IML language, you can use the BIN function to assign observations to bins.
However, sometimes it is useful to have approximately the same number of observations in each group. In this case, you can group the observations into k quantiles. One way to do this is to use PROC RANK and to specify the GROUPS= option, as follows:
%let NumGroups = 4; proc rank data=Sashelp.class out=class groups=&NumGroups ties=high; var Height; /* variable on which to group */ ranks Group; /* name of variable to contain groups 0,1,...,k-1 */ run; |
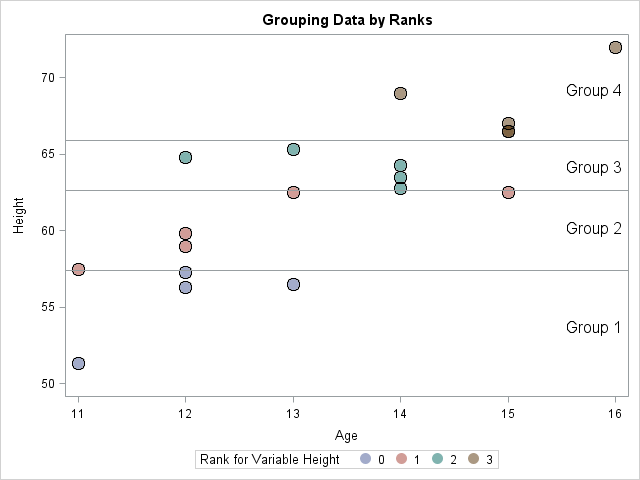
A scatter plot of the data (click to enlarge) is shown with markers colored by group membership. There are 19 observations in this data set. The RANK procedure puts four observations into the first group and five observations into each of the next three groups, which is an excellent distribution of the 19 observations into four groups. (In Group 4, there are two markers with the coordinates (15, 66.5).) The TIES= option specifies how to handle tied values. I specified TIES=HIGH because that option is consistent with the definition of a quantile for a discrete distribution.
In the SAS/IML language, you can use the QNTL subroutine and the BIN function to construct a function that groups observations by quantiles, as follows:
proc iml;
/* Assign group to each observation based on quantiles.
   For example, g=GroupRanks(x,4) assigns each observation
   to a quartile. Assume x is a column vector and k is less
   than the number of unique values of x */
start GroupRanks(x, k);
   if k<2 then return(j(nrow(x), 1, 1));
   dx = 1/k;
   p = do(dx, 1-dx/2, dx);  /* 4 groups ==> p={0.25 0.50 0.75} */
   call qntl(q, x, p);
   Group = bin(x, .M // q // .I);
   return(Group);
finish;

/* run example */
use Sashelp.Class;  read all var {Height};  close;
Group = GroupRanks(Height, 4); |
The call to the GroupRanks function results in the same assignment of observations to groups as PROC RANK, except that the GroupRanks function uses the identifiers 1,2,...,k. The GroupRanks function uses two tricks:
- The QNTL function finds k–1 "cut points" that divide the values of x into k groups, with about the same number of observations in each group.
- The special missing values .M and .I correspond to "minus infinity" and "plus infinity," respectively. These special values are appended to the other cut points and supplied as parameters to the BIN function. The BIN function returns a vector with the values 1, 2, ...,k that classifies each observation into a bin.
There are several statistical uses for creating k groups with roughly the same number of observations in each group. One is when assigning colors to a choropleth map or a heat map. Rather than chop the range of the response variable into k equal intervals, it is often better to choose 5 or 7 quantiles and color the regions by quantiles of the response. This technique is especially valuable when the response variable has a long-tailed distribution.

2 Comments
Pingback: Bin observations by using custom cut points and unevenly spaced bins - The DO Loop
Pingback: Binning data by quantiles? Beware of rounded data - The DO Loop