A reader asked:
I want to create a vector as follows. Suppose there are two given vectors x=[A B C] and f=[1 2 3]. Here f indicates the frequency vector. I hope to generate a vector c=[A B B C C C]. I am trying to use the REPEAT function in the SAS/IML, language but there is always something wrong. Can you help me?
This is probably a good time to remind everyone about the SAS/IML Support Community. You can post your SAS/IML questions there 24 hours a day. That is always a better plan than making a personal appeal to me, because I receive dozens of questions like this every month, and there is no way that I can personally reply. There are lots of experienced SAS/IML experts out there, so please use the SAS/IML Community to tap into that knowledge.
That said, I think the answer to this reader's question makes an interesting example of statistical programming with SAS/IML software. It is trivial to solve this in the DATA step (see the end of this article), but how might you solve it in the SAS/IML language? If you'd like to try to solve this problem yourself, stop reading here. Spoilers ahead!
Editor's note: SAS/IML 12.3 has an enhanced version of the REPEAT function that makes this process much simpler.
Create a new vector that duplicates frequencies
The goal is to write a function that duplicates or "expands" data that have a frequency variable. The important function to use for this task is the CUSUM function, which computes the cumulative frequencies. Let's look at a simple example and apply the CUSUM function to the frequency vector:
proc iml;
values={A,B,C,E};
freq = {2,1,3,4};
cumfreq = cusum(freq);
print values freq cumfreq; |
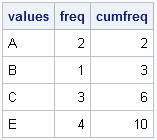
As shown in the output, the cumfreq variable contains the indices for the expanded data. The expanded data will be a vector that contains 10 elements. The first data value (A) repeats twice (the freq value), so it repeats until element 2 (the cumfreq value) in the expanded vector. The second category fills element 3. The next category repeats 3 times, so it occupies up through element 6 in the expanded vector. The last category repeats until element 10. The following DO loop specifies each data value and the indices of the expanded vector that it should occupy:
print (values[1])[label="value"] (1:cumFreq[1])[label="Indices"]; do i = 2 to nrow(values); bIdx = 1 + cumFreq[i-1]; /* begin index */ eIdx = cumFreq[i]; /* end index */ value = values[i]; print value (bIdx:eIdx)[label="Indices"]; end; |
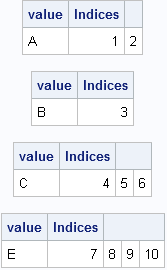
The output shows that we have all the information we need to allocate a vector of length 10 and fill it with the data values, where the ith value is repeated freq[i] times. The key, it turns out, is to use the CUSUM function to find the indices that correspond to the each data value.
A module to compute the expanded data
In SAS procedures that support a FREQ statement, the frequency values must be positive integers. If the frequency value is missing or is a nonpositive value, the corresponding data value is excluded from the analysis. It is easy to add that same feature to a module that takes a vector of values and a vector of frequencies and returns a vector that contains the data in expanded form. This is implemented in the following SAS/IML module, which allocates the result vector with the first data value in order to avoid handling the first element outside of the DO loop:
start expandFreq(_x, _freq);
   /* Optional: handle nonpositive and fractional frequencies */
   idx = loc(_freq > 0); /* trick: in SAS this also handles missing values */
   if ncol(idx)=0 then return (.);
   x = _x[idx];
   freq = round( _freq[idx] );

   /* all frequencies are now positive integers */
   cumfreq = cusum(freq);

   /* Initialize result with x[1] to get correct char/num type */
   N = nrow(x);
   expand = j(cumfreq[N], 1, x[1]); /* useful trick */

   do i = 2 to N;
      bIdx = 1 + cumFreq[i-1]; /* begin index */
      eIdx = cumFreq[i];       /* end index */
      expand[bIdx:eIdx] = x[i];/* you could use the REPEAT function here */
   end;
   return ( expand );
finish;

/* test the module */
values={A,B,C,D,E,F};
freq = {2,1,3,0,4,.}; /* include nonpositive and missing frequencies */
y = expandFreq(values, freq);
print values freq y; |
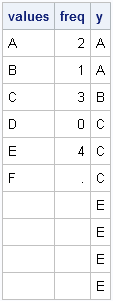
Notice that you don't actually need to use the REPEAT function because SAS/IML is happy to assign a scalar value into a vector. The scalar is automatically repeated as often as needed in order to fill the vector.
A DATA step solution
As indicated at the beginning of this post, the DATA step solution is quite simple: merely use the OUTPUT statement in a loop, as shown in the following example:
data Orig; input x $ Freq; datalines; A 2 B 1 C 3 D 0 E 4 F . ; run; /* expand original data by frequency variable */ data Expand; keep x; set Orig; if Freq<1 then delete; do i = 1 to int(Freq); output; end; run; proc print data=Expand; run; |
The output data set contains the same data as the y vector in the SAS/IML program.

9 Comments
Rick I took your challenge to have a go, and have come up with a double CUSUM approach. The idea is to generate the vector {1 0 1 1 0 0 1 0 0 0} that when CUSUMed, becomes the list of elements from x (with repeats) that you want to see. It's not going to handle the missing values and zeros, so if necessary, you would need to add your own code above to preprocess the input vectors.
proc iml;
start expfr(x,f);
return(x[cusum(element(1:f[+],cusum(1//f)))]);
finish;
values={A,B,C,E};
freq = {2,1,3,4};
print (expfr(values,freq));
quit;
Very nice! Fast, too.
Dear Sir,
I have monitored and measured height of tree seedlings for three years and would like to analyse the data now. I have with me some missing data (dead trees) and I am confused what to do with these missing data. In addition, when I work out the increment, there are negative increment due to die back, insect attack and broken top.What do I do with these negative values ? I have no other statistical software but only Excell. Please I will very much appreciate your professional advice.
Thank you.
Fantine
You might need something more powerful than Excel to do a proper repeated measure analysis. If you were using SAS, you could use PROC MIXED as in this example. My advice is to consult with a statistician in your organization who knows how to use more powerful software. I don't think the negative values will require special handling.
Pingback: The difference between frequencies and weights in regression analysis - The DO Loop
Pingback: An easy way to expand data by using frequencies - The DO Loop
Pingback: The CUSUM-LAG trick in SAS/IML - The DO Loop
Can we have decimal weights? And can we expand decimal weights data?
Frequencies are not weights. Yes, you can have decimal weights. However, you can't "expand" the weighted data.