When comparing scores from different subjects, it is often useful to rank the subjects. A rank is the order of a subject when the associated score is listed in ascending order.
I've written a few articles about the importance of including confidence intervals when you display rankings, but I haven't blogged about the basics of computing ranks. In Base SAS you can use the RANK procedure, but this article focuses on how to compute ranks and other related quantities in SAS/IML software.
Ranking Values in SAS/IML Software
When the values are in a SAS/IML vector, you can use the RANK function to assign ranks. The RANK function assigns 1 to the lowest score, 2 to the second lowest, and so on. Ties are broken arbitrarily. For example, the following statements rank the competitors in the semifinal heat of a swimming event at the 2008 Olympics according to their times (in seconds):
proc iml;
/** Men's 100m butterfly, semifinal heat **/
name = {Crocker Pini Lauterstein Cavic
        Phelps Dunford Serdinov Fujii};
times = {51.27 51.62 51.27 50.92
         50.97 51.33 51.41 51.59};
r = rank(times);
print r; |
The output tells you that the first competitor (Crocker) is ranked third, the second competitor (Pini) finished eighth, and so one. In particular, the first-place finisher was the fourth competitor in the list (Cavic) and second-place was the fifth competitor (Phelps).
Notice that the times for Crocker and Lauterstein were the same, but one was ranked third and the other fourth, which shows you that the RANK function breaks ties arbitrarily. If you want to include ties in your ranking, you can use the RANKTIE function.
The RANK function returns a matrix that is the same shape as the input matrix. This means that you can compute the ranks for column vectors, row vectors, and matrices.
Reordering by Rank
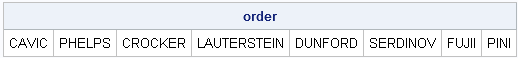
You can use the rank to order the competitors by their times. To do this, make a copy of the data and use the ranks, r, to index the data on the left hand side of the equal sign:
order = name; /** copy data **/ order[,r] = name; /** order by rank **/ print order; |
This syntax might seem strange. Why do you need to index the data on the left hand side? The simple answer is "because that's how ranks work." A rank is different from a sorting index such as is produced by the SORTNDX subroutine. As I showed in a previous post, when you use a sorting index to sort a matrix, you use the index on the right hand side of the equal sign. For this reason, the sorting index is sometimes called the anti-rank. The following statements compute the anti-rank from the rank vector, and by using the SORTNDX subroutine:
/** compute anti-rank from rank **/ ar = r; ar[,r] = 1:ncol(r); /** permute indices **/ /** SORTNDX operates on columns! **/ call sortndx(idx, times`, 1); |
The two vectors, ar and idx, contain the same values in the same order, but ar is a row vector whereas idx is a column vector. (The SORTNDX function always operates on the columns of the input data and always returns a column vector.) You can use either of these vectors as indices on the right side of the equal sign to reorder the data:
order2 = name[idx]; |
Rank Values in Descending Order
Here's one last tip. The RANK function ranks data in ascending order, which is good for sports such as racing and golf in which the lowest score wins. However, in other sports, teams with higher scores are ranked ahead of teams with lower scores. Thus, you need to be able to rank data in descending order.
If there are N teams and r is the result of the RANK function, you can flip the order of the ranks by using the following statements:
N = ncol(r); /** or nrow(r) **/ RankDesc = N + 1 - r; |
Alternatively, you can call the RANK function and pass in the negative of the scores. For example, to rank the Olympic swimmers in descending order:
RankDesc = rank( -times ); |

4 Comments
Rick:
For Poisson distribution (ie., we know number of cases, expected deaths and observed deaths by institution), how to use SAS/IML to produce funnel plot?
Thanks,
Zhongmin
Did you mean to post this comment to http://blogs.sas.com/iml/index.php?/archives/120-Funnel-Plots-An-Alternative-to-Ranking.html ?
There are two approaches. You can follow what I did in the post, except apply different formulas as given in the appendices of Spiegelhalter, 2004. Alternatively, you can get an ANOM plot (see http://blogs.sas.com/iml/index.php?/archives/128-How-to-Compute-Decision-Limits-for-Multiple-Comparisons.html) directly from PROC GENMOD by using the LSMEANS statement and ODS GRAPHICS ON. For a GENMOD example, see http://support.sas.com/documentation/cdl/en/statug/63347/HTML/default/viewer.htm#statug_genmod_sect006.htm , but use an LSMEANS statement such as
lsmeans car / diff=anom adjust=nelson;
Pingback: Interpolation vs extrapolation: the convex hull of multivariate data - The DO Loop
Pingback: Compute tied ranks - The DO Loop