Toe bone connected to the foot bone,
Foot bone connected to the leg bone,
Leg bone connected to the knee bone,...
— American Spiritual, "Dem Bones"
Last week I read an interesting article on Robert Kosara's data visualization blog. Kosara connected the geographic centers of the US zip codes in the lower 48 states, in order, from 01001 (Agawam, MA) to 99403 (Clarkston, WA). Since the SasHelp.zipcode data set is one of the sample data sets that is distributed with SAS, it is a simple matter to recreate the graph with SAS. The following SAS statements sort the data and exclude certain American territories before graphing the locations of the US zip code in the contiguous US. (Click on a graph to enlarge it.):
proc sort data=sashelp.zipcode(where=(StateCode NOT IN ("PR", "FM", "GU", "MH", "MP", "PW", "VI") /* exclude territories */ AND ZIP_Class = " ")) /* exclude "special" zip codes */ out=zipcode(keep=ZIP x y City StateCode); by zip; run; title "Path of US Zip Codes in Numerical Order"; proc sgplot data=zipcode noborder; where StateCode NOT IN ("AK", "HI"); /* contiguous US */ series x=X y=Y / group=StateCode; xaxis display=none; yaxis display=none; run; |
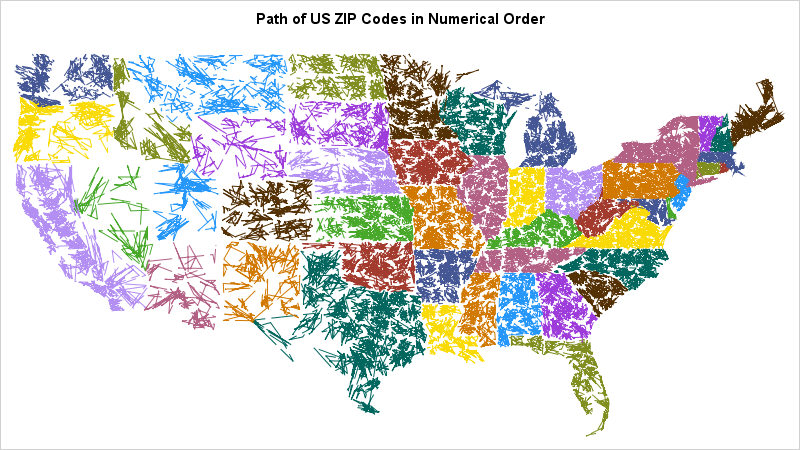
Note that the coordinates are "raw" longitudes and latitudes; no projection is used. The graph is interesting. On this scale, the western states clearly show that the zip codes form small clusters within the states. This fact is also true for the Eastern states, but it is harder to see because of the greater density of zip codes in those states. Kosara includes an interactive map that enables you to zoom in on regions of interest. To create a static "zoomed-in" version in SAS, you can use WHERE processing to subset the data. You can also add state boundaries and labels to obtain a close-up map, such as this map of Utah (UT), Colorado (CO), Arizona (AZ), and New Mexico (NM):
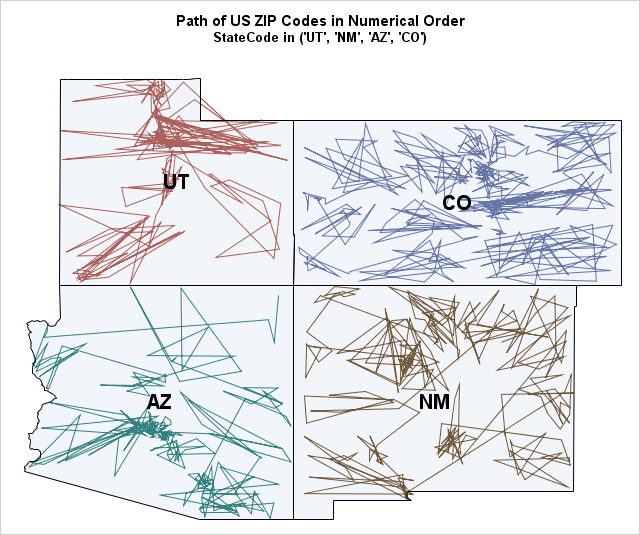
This graph shows that there are about a dozen zip-code clusters within each of these states. This reflects the hierarchical nature of zip codes. By design, the first digit in a zip code specifies a region of the country, such as the Southeast or the Midwest. The next two digits determine the Sectional Center Facility (SCF) code, which is a region within a state. From looking at the map, I conjecture that those clusters of jagged line segments are approximations of the SCFs.
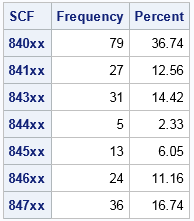
You can use the following SAS code to generate the SCF from the zip code. The subsequent call to PROC FREQ counts the number of zip codes in each SCF in Utah. Some SCFs have many postal delivery zones within them (for example, 840xx) whereas others have relatively few (for example, 844xx). Note that the SCFs are not necessarily contiguous: Utah does not (yet) have zip codes of the form 842xx.
data Zip1; length SCF $5.; set zipcode; FloorZip = floor(zip/100); /* round down to nearest 100 */ SCF = putn(FloorZip,"Z3.")||"xx"; /* Sectional Center Facility, eg, 841xx */ keep x y zip StateCode City SCF; run; proc freq data=Zip1; where StateCode='UT'; tables SCF / nocum; run; |
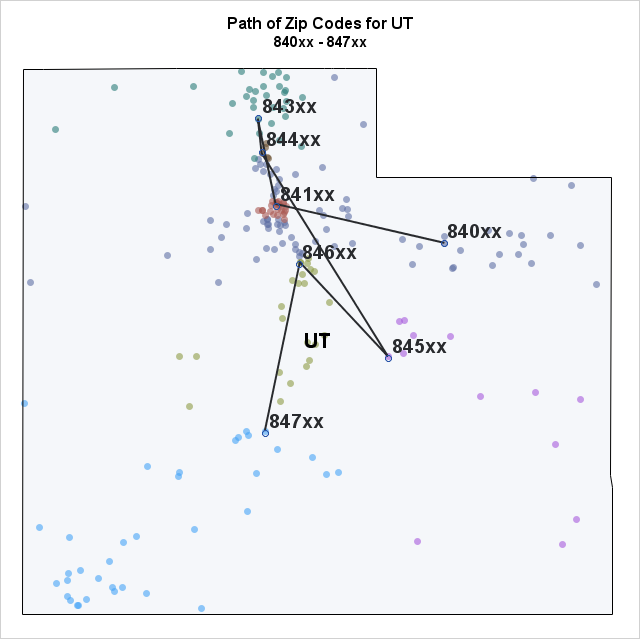
If you choose a point within each Sectional Center Facility and connect those points in order, you can obtain a much less cluttered diagram that shows the basic progression of the hierarchy of zip codes. The SCFs can zig-zag across a state and do not necessarily follow a geographical progression such as north-south or east-west. The following image connects the location of the first zip code in each SCF region in Utah. The individual zip-code centers are shown as markers that are colored by the SCF.
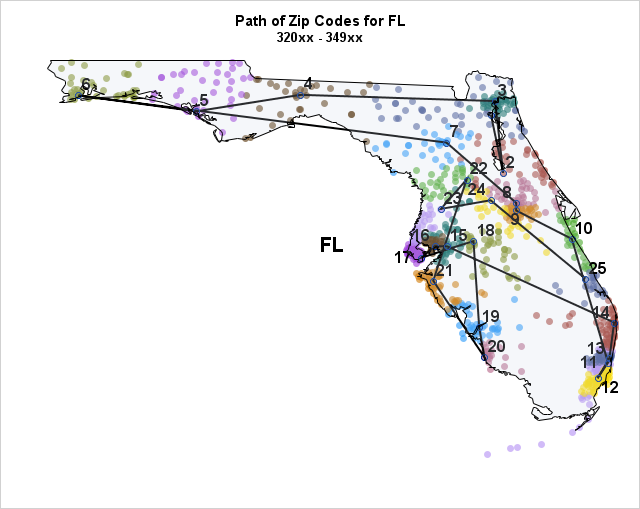
For states that have more than a dozen SCFs, the five-character labels can obscure the path of the SCFs. If you don't care about the actual zip-code prefixes but you just want to visualize the progression, you can label positions along the path by integers. For example, there are 25 SCFs in Florida. The following graph visualizes the regions. The first SCF (320xx) is labeled '1' and the last SCF (349xx) is labeled '25'.
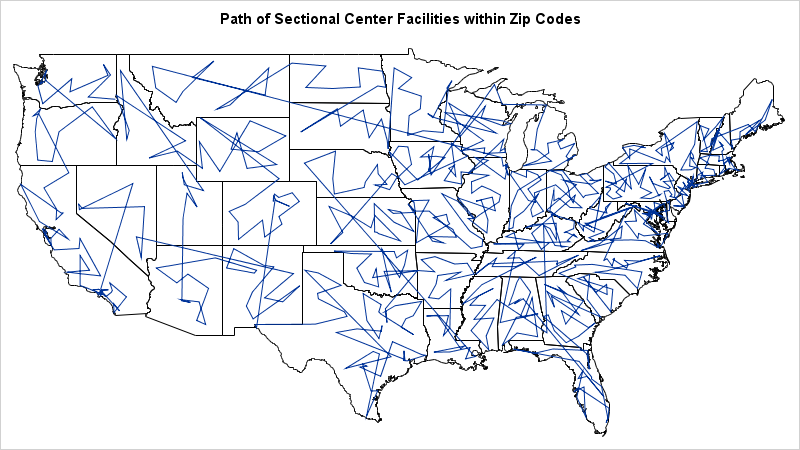
Lastly, the following graph shows the progression of Sectional Center Facilities at the national level. You can see certain large "jumps" across multiple states. These are present in the original map of zip codes but are obscured by the complexity of thousands of crisscrossing line segments. Two large jumps that are apparent are a diagonal line from Montana in the Pacific Northwest (prefix '59') down to Illinois (prefix '60'). Another big jump is from Nebraska in the Midwest (prefix '69') down to Louisiana (prefix '70') in the South-Central region.
In summary, this article uses SAS to reproduce the fascinating image on Robert Kosara's blog. Kosara's image is the path obtained by connecting the geographic centers of each zip code. By zooming in on individual states, you can identify clusters of zip codes, which correspond to Sectional Center Facilities (SCFs). By choosing one zip code from each SCF and connecting those locations in order, you obtain a simplified version of the path that connects major postal zones.
If you would like to explore these data yourself, you can download the SAS program that analyzes the zip code data.

2 Comments
Thanks for posting! I've wondered why a couple streets over can have a zip code that isn't exactly sequential.
I definitely thought this was a Robert Allison post by the end - well done with the deep explanation of the visualization & good use of colors!
Thanks for the comments and kind words. I'm glad you enjoyed it.