A SAS customer asked how to use SAS to conduct a Z test for the equality of two proportions. He was directed to the SAS Usage Note "Testing the equality of two or more proportions from independent samples." The note says to "specify the CHISQ option in the TABLES statement of PROC FREQ to compute this test," and then adds "this is equivalent to the well-known Z test for comparing two independent proportions."
You might wonder why a chi-square test for association is equivalent to a Z test for the equality of proportions. You might also wonder if there is a direct way to test the equality of proportions. This article implements the well-known test for proportions in the DATA step and compares the results to the chi-square test results. It also shows how to get this test directly from PROC FREQ by using the RISKDIFF option.
A chi-square test for association in SAS
The SAS Usage Note poses the following problem: Suppose you want to compare the proportions responding "Yes" to a question in independent samples of 100 men and 100 women. The number of men responding "Yes" is observed to be 30 and the number of women responding Yes was 45.
You can create the data by using the following DATA step, then call PROC FREQ to analyze the association between the response variable and gender.
data Prop; length Group $12 Response $3; input Group Response N; datalines; Men Yes 30 Men No 70 Women Yes 45 Women No 55 ; proc freq data=Prop order=data; weight N; tables Group*Response / chisq; run; |
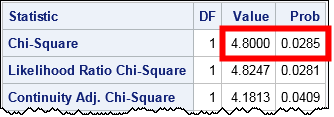
As explained in the PROC FREQ documentation, the Pearson chi-square statistic indicates an association between the variables in the 2 x 2 table. The results show that the chi-square statistic (for 1 degree of freedom) is 4.8, which corresponds to a p-value of 0.0285. The test indicates that we should reject the null hypothesis of no association at the 0.05 significance level.
As stated in the SAS Usage Note, this association test is equivalent to a Z test for whether the proportion of males who responded "Yes" equals the proportion of females who responded "Yes." The equivalence relies on a fact from probability theory: a chi-square random variable with 1 degree of freedom is the square of a random variable from the standard normal distribution. Thus the square root of the chi-square statistic is the Z statistic (up to a sign) that you get from the test of equality of two proportions. Therefore the Z statistic should be z = ±sqrt(4.8) = ±2.19. The p-value is unchanged.
Z test for the equality of two proportions: A SAS DATA step implementation
For comparison, you can implement the classical Z test by applying the formulas from a textbook or from the course material from Penn State, which includes a section about comparing two proportions. The following DATA step implements the Z test for equality of proportions:
/* Implement the Z test for pre-summarized statistics. Specify the group proportions and sizes. For formulas, see https://onlinecourses.science.psu.edu/stat414/node/268 */ %let alpha = 0.05; %let N1 = 100; /* total trials in Group1 */ %let Event1= 30; /* Number of events in Group1 */ %let N2 = 100; /* total trials in Group2 */ %let Event2= 45; /* Number of events in Group2 */ %let Side = 2; /* use L, U, or 2 for lower, upper, or two-sided test */ title "Test of H0: p1=p2 vs Ha: p1^=p2"; /* change for Side=L or U */ data zTestProp; p1Hat = &Event1 / &N1; /* observed proportion in Group1 */ var1 = p1Hat*(1-p1Hat) / &N1; /* variance in Group1 */ p2Hat = &Event2 / &N2; /* observed proportion in Group2 */ var2 = p2Hat*(1-p2Hat) / &N2; /* variance in Group2 */ /* use pooled estimate of p for test */ Diff = p1Hat - p2Hat; /* estimate of p1 = p2 */ pHat = (&Event1 + &Event2) / (&N1 + &N2); pVar = pHat*(1-pHat)*(1/&N1 + 1/&N2); /* pooled variance */ SE = sqrt(pVar); /* estimate of standard error */ Z = Diff / SE; Side = "&Side"; if Side="L" then /* one-sided, lower tail */ pValue = cdf("normal", z); else if Side="U" then /* one-sided, upper tail */ pValue = sdf("normal", Z); /* SDF = 1 - CDF */ else if Side="2" then pValue = 2*(1-cdf("normal", abs(Z))); /* two-sided */ format pValue PVALUE6.4 Z 7.4; label pValue="Pr < Z"; drop var1 var2 pHat pVar; run; proc print data=zTestProp label noobs; run; |
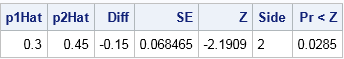
The DATA step obtains a test statistic of Z = –2.19, which is one of the square roots of the chi-square statistic in the PROC FREQ output. Notice also that the p-value from the DATA step matches the p-value from the PROC FREQ output.
Test equality of proportions by using PROC FREQ
There is actually a direct way to test for the equality of two independent proportions: use the RISKDIFF option in the TABLES statement in PROC FREQ. In the documentation, binomial proportions are called "risks," so a "risk difference" is a difference in proportions. (Also, a "relative risk" (the RELRISK option) measures the ratio of two proportions.) Equality of proportions is equivalent to testing whether the difference of proportions (risks) is zero.
As shown in the documentation, PROC FREQ supports many options for comparing proprtions. You can use the following suboptions to reproduce the classical equality of proportions test:
- EQUAL requests an equality test for the difference in proportion. By default, the Wald interval (METHOD=WALD) is used, but you can choose other intervals.
- VAR=NULL specifies how to estimate the variance for the Wald interval.
- (optional) CL=WALD outputs the Wald confidence interval for the difference.
Combining these options gives the following direct computation of the difference between two proportions:
proc freq data=Prop order=data; weight N; tables Group*Response / riskdiff(equal var=null cl=wald); /* Wald test for equality */ run; |
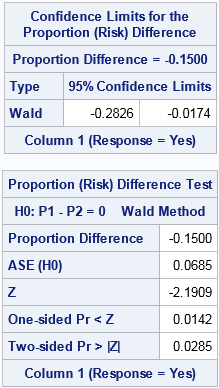
The 95% (Wald) confidence interval is shown in the first table. The confidence interval is centered on the point estimate of the difference (-0.15). The interval does not contain 0, so the difference is significantly different from 0 at the 0.05 significance level.
The second table shows the result of the Wald equality test. The "ASE (H0)" row gives the estimate for the (asymptotic) standard error, assuming the null hypothesis. The Z score and the two-sided p-value match the values from the DATA step computation, and the interpretation is the same.
Summary
In summary, the SAS Usage Note correctly states that the chi-square test of association is equivalent to the Z test for the equality of proportion. To run the Z test explicitly, this article uses the SAS DATA step to implement the test when you have summary statistics. As promised, the Z statistic is one of the square roots of the chi-square statistic and the p-values are the same. The DATA step removes some of the mystery regarding the equivalence between these two tests.
However, writing DATA step code cannot match the convenience of a procedure. For raw or pre-summarized data, you can use the RISKDIFF option in PROC FREQ to run the same test (recast as a difference of proportions or "risks"). To get exactly the same confidence intervals and statistics as the classical test (which is called the Wald test), you need to add a few suboptions. The resulting output matches the DATA step computations.

7 Comments
Thank you. I once created a plug-n-play spreadsheet application to test the equality of two proportions.
Thanks for the example Rick. This one can throw you if you don't dig into it a bit. A lot of the examples will use the option: testp=(30 12 30 25 3). This does something different. When you're first learning chi-squared a lot of the text will start with an example where the intended proportions are stated, and you are just looking for conformity to those proportions. The testp option is good for that. In real life though, you are often wanting to compare two data groups, both randomly sampled from the environment and you want to ask how likely it is that they are drawn from the same population with respect to proportions. That's a different question because both are random draws and neither is locked down. That means there are two sources of uncertainty, not one. Your example shows how to estimate Ho for p_1 = p_2 in that situation.
Thanks.
Thanks for writing and for sharing your thoughts and experience.
Hi Rick,
How to incorporate small sample correction (class frequency less than 5) in this code with proc freq for testing equality of proportions?
The SAS Usage Note that I link to in the first paragraph discusses this issue. Briefly, you can use Fisher's exact test.
HI, When I try to find difference in proportion, SAS is giving a value slightly different that what I calculated manually.
There are several ways to estimate a difference in proportions. Check the documentation to make sure you and SAS are using the same method. If you can't figure it out, post your data and SAS program to the SAS Support Communities.