Suppose you have several discrete variables. You want to conduct a frequency analysis of these variables and print the results, but ONLY for variables that have three or more levels. In other words, you want to conditionally display some results, but you don't know which variables satisfy the condition until after you run the analysis.
An experienced SAS programmer can probably think of several ways to solve this problem. The simplest solution requires going through the data twice. During the first pass you use PROC SQL or PROC FREQ to count the number of distinct levels for each variable. You then create a list of the variables that have three or more levels and call PROC FREQ on those variables and show the one-way frequency tables that result.
That is a fine solution. However, I read the question just after I finished writing an article about how to select and reorder output with PROC DOCUMENT. It occurred to me that a more efficient solution is to let PROC FREQ compute tables for all the variables, but use PROC DOCUMENT to display only the tables that satisfy the condition. If you don't mind extra complexity, you can even use the DATA step and CALL EXECUTE to automate some of the replaying, a technique that I learned from a 2016 paper by Warren Kuhfeld. (He uses similar ideas in his free e-book Advanced ODS Graphics Examples.)
To demonstrate this technique, I will create a modified version of the Sashelp.Cars data. The following DATA step copies the data and adds two new character variables, one with one level and another with two levels:
data Have; set sashelp.cars; c1 = "A"; if _N_ < 100 then c2 = "A"; else c2 = "B"; run; |
Step 1: Store the output in a document
The goal is to print ONLY frequency tables for variables that have three or more levels. The following ODS statements suppress output to all open destinations, open the DOCUMENT destination (named "RDoc"), and select only the OneWayFreqs table. The ODS OUTPUT destination is used to save the "NLevels" table of PROC FREQ, which contains information about the number of levels in each variable.
ods exclude all; /* suppress output */ ods document name=RDoc(write); /* write to document */ ods document select OneWayFreqs; /* these tables go into the doc */ ods output NLevels=Levels; /* save number of levels to data set */ proc freq data=Have nlevels; tables origin c1 cylinders c2 type; /* specify variables to analyze */ run; ods document close; ods exclude none; |
If the preceding statements seem confusing, try running just the PROC FREQ statement. It produces five frequency tables and an output data set (Levels) which contains the number of levels for each variable. The other ODS statements just ensure that only the DOCUMENT destination receives the OneWayFreqs tables.
Step 2: Examine the names of the objects in the document
While developing the program, you will want to see the contents of the Levels data and the RDoc document, as follows. These statements will not appear in the final program.
proc print data=Levels noobs; var TableVar NLevels; run; proc document name=RDoc; list ^ (where=(_TYPE_="Table")) / levels=all; /* list all tables */ run; quit; |
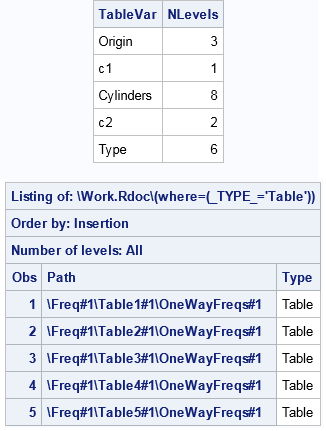
The first table shows which variables have three or more levels. The second table lists the names of the tables in the document. The variables are stored in the same order as the variables in the Levels data set.
Step 3: Display the output for certain variabes
If you were doing this task manually, you would look at the Levels data set and conclude that the first, third, and fifth variables have three or more levels. You could then use the REPLAY statement in PROC document to display those tables. The manual code would look like the following:
/* No automation: Print only OneWayFreqs tables w/ 3 or more levels */ proc document name=RDoc(read); replay \Freq#1\Table1#1\OneWayFreqs#1; /* display Table1 */ replay \Freq#1\Table3#1\OneWayFreqs#1; /* display Table3 */ replay \Freq#1\Table5#1\OneWayFreqs#1; /* display Table5 */ run; quit; |
The observant programmer will notice that these statements are just the result of an algorithm:
- Loop over each row in the Levels data set
- If the NLevels variable is greater than some threshold, output the corresponding table.
You can program that algorithm in the SAS DATA step and generate the corresponding PROC DOCUMENT statements. One way is to write the statements to a text file and then use the %INCLUDE statement to execute the statements. An alternative approach is to use the CALL EXECUTE subroutine to buffer up the statement so that they run when the DATA step terminates, as shown by the following program:
%let L = 3; /* print only OneWayFreqs tables w/ L or more levels */ options source; /* show the statements submitted by CALL EXECUTE*/ title "Replay only the tables that contain &L or more levels"; data _NULL_; set Levels end=EOF; /* implicit loop over rows of the data */ if _N_ = 1 then /* first statement */ call execute('proc document name=RDoc(read);'); if NLevels >= &L then /* replay tables that satisfy condition */ call execute('replay \Freq#1\Table'|| strip(putn(_N_,3)) ||'#1\OneWayFreqs#1;'); if EOF then /* last statement */ call execute('run; quit;'); run; |
The DATA step generates the complete call to PROC DOCUMENT, which executes after the DATA set exits. The result is that one-way frequency tables are conditionally printed. Although PROC FREQ analyzed all the variables, only the tables that have more than three levels are displayed.
If you haven't seen this technique before, it might be a little jarring because you are using a SAS program to write a SAS program. This is an advanced technique, to be sure, but one that can be very useful. It can be adapted to many other situations in which you want to conditionally display certain tables, but you must run the analysis before you know which tables satisfy the condition.
