Typically a correlation analysis reports the correlations between all pairs of variables, including the variables with themselves. The resulting correlation matrix is square, symmetric, and has 1s on the main diagonal. But suppose you are interested in only specific combinations of variables. Perhaps you want the pairwise correlations between one group that contains n1 variables and another group of n2 variables.
No worries. The CORR procedure in Base SAS supports the WITH statement which enables you to compute and display a subset of the correlations between variables.
Correlations of certain variables WITH other variables
Often variables naturally fall into groups. For example, in the Sashelp.Cars data, the variables are related to four groups: price, power of the engine, fuel economy, and size of vehicle. In a medical study you might have certain variables related to physical characteristics that will not be affected by the study (age, height, gender) and other variables that might be affected (blood pressure, cholesterol, weight).
In many cases, you are interested in the correlations between the groups. For example, the following PROC CORR analysis uses the VAR statement to specify four variables in one group and the WITH statement to specify three variables in another group. The procedure computes the 12 correlations between the two sets of variables:
/* default handling of missing values is pairwise */ proc corr data=Sashelp.Heart noprob nosimple; var AgeCHDDiag Height Weight MRW; with Diastolic Systolic Cholesterol; run; |
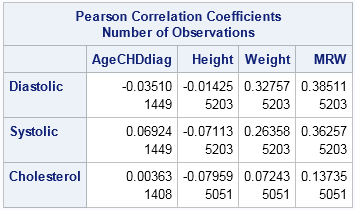
Several variables in the Sashelp.Heart data set contain missing values. The table shows the correlations (top of each row) and the number of nonmissing values (bottom of each row) that are used to compute each correlation. The default handling of missing values in PROC CORR is pairwise exclusion, which is why different cells in the table report different numbers of nonmissing values.
The same computation in SAS/IML
This article was motivated by a question that a SAS customer asked on a discussion forum. The question was "How can you do this computation in SAS/IML?" The customer noted that the CORR function in SAS/IML accepts only a single data matrix.
Nevertheless, you can use the CORR function for this computation because the pairwise correlations that you want are a submatrix of the full correlation matrix. That means that you can compute the full correlation matrix (with pairwise exclusion of missing values) and use array indices to extract the relevant submatrix, as follows:
proc iml; varNames = {"AgeCHDDiag" "Height" "Weight" "MRW"}; withNames = {"Diastolic" "Systolic" "Cholesterol"}; names = varNames || withNames; use Sashelp.Heart; read all var names into X; /* read VAR and WITH variables */ close; corr = corr(X, "pearson", "pairwise"); /* compute for correlations */ vIdx = loc( element(names, varNames) ); /* columns of 1st set of variables */ wIdx = loc( element(names, withNames) ); /* columns of 2nd set of variables */ withCorr = corr[wIdx, vIdx]; /* extract submatrix */ print withcorr[r=withNames c=varNames]; |
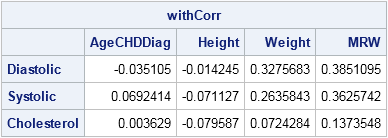
Notice that the column indices for the VAR and WITH variables are computed by using the LOC-ELEMENT technique, although for this example the columns are simply 1:4 and 5:7. The correlations are the same as were produced by PROC CORR.
However, you might be concerned that we are doing more work than is necessary. The CORR function computes the entire 7x7 matrix of correlations, which requires computing 28 pairwise correlations, when all we really need is 12. The computation is even less efficient if the VAR and WITH lists are vastly different in size, such as one variable in the first list and six in the second.
To be more efficient, you might want to compute only the correlations that you really need. The following module computes only the pairwise correlations that you specify:
/* Compute correlations between groups of variables. Use pairwise exclusion of missing values. Specify the data matrix X and indices for the columns that correspond to the VAR and WITH variables. */ start CorrWith(X, varIdx, withIdx, method="Pearson"); withCorr = j(ncol(withIdx), ncol(varIdx)); do i = 1 to ncol(withIdx); w = withIdx[i]; /* column for WITH var */ do j = 1 to ncol(varIdx); v = varIdx[j]; /* column for VAR var */ withCorr[i,j] = corr(X[,v||w], method, "pairwise")[1,2]; end; end; return(withCorr); finish; withCorr = CorrWith(X, vIdx, wIdx); print withcorr[r=withNames c=varNames]; |
The output is identical to the previous output, and is not shown.

2 Comments
Dear Sir,
I have four systems with different practices, i want to calculate the correlation between the variables for each group separately. just to identify what is going in each system. how i can perform this in sas?
Use the BY statement to analyze each system separately. For example:
If that doesn't answer your question, post your question to the SAS Support Communities.