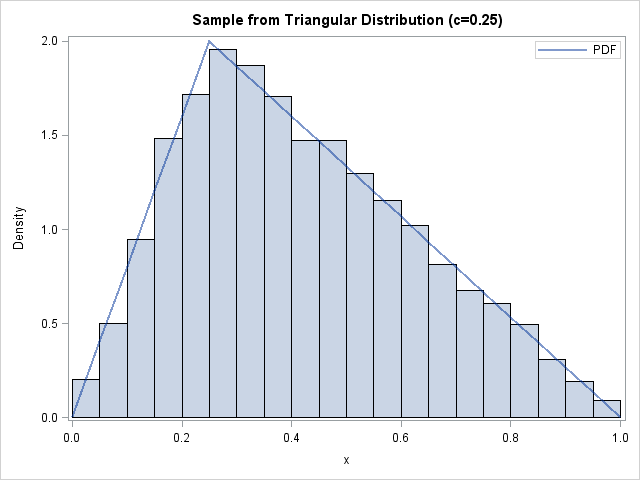
The triangular distribution has applications in risk analysis and reliability analysis. It is also a useful theoretical tool because of its simplicity. Its density function is piecewise linear. The standardized distribution is defined on [0,1] and has one parameter, 0 ≤ c ≤ 1, which determines the peak of the density. The histogram at left shows 10,000 random draws from a triangular distribution with c=0.25, overlaid with the triangular density function.
Because the triangular distribution is so simple, you can write down an explicit formula for its cumulative and inverse cumulative distribution function. The density is piecewise linear, so the cumulative distribution function (CDF) is piecewise quadratic. The inverse CDF is expressed in terms of a piecewise function that contains square roots.
I assumed that everything about this simple distribution has been known for 100 years. Therefore I was surprised to discover a 2009 paper titled "A new method to simulate the triangular distribution" (Stein and Keblis).
In the short paper, the authors note that the triangular distribution can be expressed as a linear combination of two other densities: a linear increasing density on [0,1] and a linear decreasing density on [0,1]. They then note that the first density is the density for the random variable MIN(u, v), where u and v are independent uniform random variates. Similarly, the second density is the density for the random variable MAX(u, v). Consequently, they realized that you can simulate a random variate from the triangular distribution by generating u and v and setting x = (1-c)*MIN(u,v) + c*MAX(u,v). They call this the MINMAX method for generating x.
The RAND function in the DATA step and the RANDGEN function in SAS/IML have built-in support for the triangular distribution. Nevertheless, it is fun to implement new algorithms, so let's compare the MINMAX algorithm by Stein and Keblis to the traditional simulation algorithm, which is the inverse CDF method.
You can use the DATA step to implement the MINMAX algorithm, but I will use SAS/IML because it is easier to compare the performance of algorithms. The following program computes one million random variates from the triangular distribution in three ways: by calling the RANDGEN subroutine, by using the SAS/IML language to implement the inverse CDF algorithm, and by implementing the MINMAX algorithm by Stein and Keblis.
proc iml;
call randseed(123456);
N = 1e6;
c = 0.25;
time = j(1,3,.);

/* Built-in method: Call RAND or RANDGEN directly */
t0 = time();
   x = j(N,1);
   call randgen(x, "Triangle", c);
time[1] = time()-t0;

/* Inverse CDF method */
t0 = time();
   u = j(N,1);
   call randgen(u, "Uniform");
   x = choose(u<=c, sqrt(c*u), 1 - sqrt((1-c)*(1-u)));
time[2] = time()-t0;

/* MINMAX method: Stein and Keblis (2009) */
t0 = time();
   u = j(N,2);
   call randgen(u, "Uniform");
   x = (1-c)*u[,><] + c*u[,<>];       /* (1-c)MIN + c*MAX */
time[3] = time()-t0;

print N[F=comma9.] time[c={"Rand" "InvCDF" "MinMax"} F=6.4 L=""]; |

The table shows that you can simulate one million random variates from the triangular distribution in 0.02 seconds by calling the RANDGEN subroutine. If you implement the inverse CDF method "by hand," it takes about 0.06 seconds. If you implement the MINMAX algorithm of Stein and Keblis, that algorithm also takes about 0.06 seconds.
You can draw a few conclusions from this exercise:
- The SAS/IML language is fast. This is why researchers often use SAS/IML for simulation studies. In my book Simulating Data with SAS I show how to implement simulation studies efficiently in SAS/IML. Even the most complicated simulation in the book completes in less than 30 seconds.
- SAS/IML is versatile. It is easy to implement new algorithms in the language.
- SAS/IML is compact. As a matrix language, you can implement an entire algorithm with a few SAS/IML statements.
- SAS/IML is convenient. Not only was I able to implement two different simulation algorithms, but I was able to easily compare the performance of the algorithms.
I guess another lesson from this exercise is that there is always something new to learn...even about a simple distribution that has been studied for hundreds of years!
