"Daddy, help! Help me! Come quick!"
I heard my daughter's screams from the upstairs bathroom and bounded up the stairs two at a time. Was she hurt? Bleeding? Was the toilet overflowing?
When I arrived in the doorway, she pointed at the wall and at the floor. The wall was splattered with black nail polish. On the floor laid a broken bottle in an expanding pool of black ooze.
"It slipped," she sobbed.
As a parent, I know that there are times when I should not raise my voice. I knew intellectually that this was one of those times. But staring at that wall, seeing what I was seeing, I could not prevent myself from yelling.
"Oh my goodness!" I exclaimed. "Is that a logarithmic spiral?"
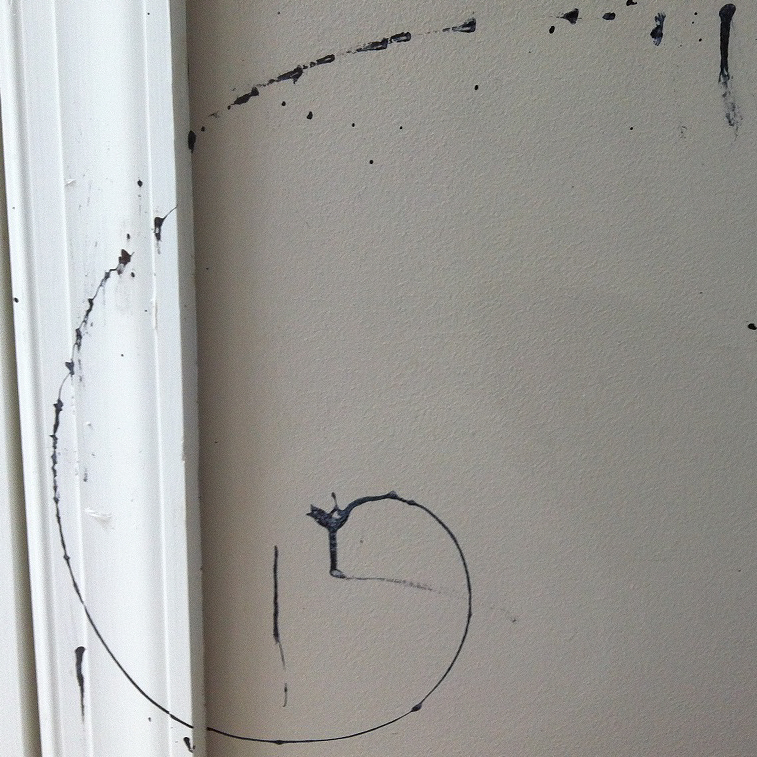
There on the wall was a spiral formed from the drops of black nail polish as the bottle had spiraled out of my daughter's hands and ejected its contents. Logarithmic spirals appear in many natural phenomena, such as the spiral arms of galaxies, the bands of hurricanes, and the curve of a mollusk's shell. However, I had not expected to see such a beautiful spiral of splattered nail polish on my wall.
I took a picture of the spiral, and we began a futile attempt to clean the wall. The nail polish proved impossible to wipe from the wall, although we were able to clean the tile floor.
How do you fit a logarithmic spiral?
As I was cleaning up the mess, my mind was racing. Is this really a logarithmic spiral? Could I construct a "spiral of best fit" that passes through the splattered drops?
I remembered that I once fit a circle to data by minimizing the radial distance between the data points and a circle with center (x0, y0) and radius R. This problem seems similar, but there are two differences. In the circle problem, I used the implicit equation of a circle (x-x0)2 + (y-y0)2 = R2. The logarithmic spiral is usually given explicitly as a polar (parametric) curve with the standard form R(θ) = a*exp(bθ), where a and b are unknown parameters. The second problem is that the spiral has multiple branches. For example, in the vertical direction there are several polar angles (π/2 and 5π/2), each with a different radius.
To construct a "spiral of best fit," you can do the following:
- Choose a coordinate system and use the photo to find the (x,y) coordinates of points along the spiral curve.
- Create an objective function whose minimum will produce parameters for the spiral that best fits the data. This problem has four parameters: The center of the spiral (x0, y0) and the two parameters a and b the amplitude and decay rate for the logarithmic spiral.
- Fit the curve to the data and see if the splatter marks on the wall appear to be modeled by the curve.
Finding points along the curve
As punishment for my daughter's carelessness, I told her that she had to help me input data from the photograph. She claimed that this punishment was "cruel and unusual," but she did it anyway.
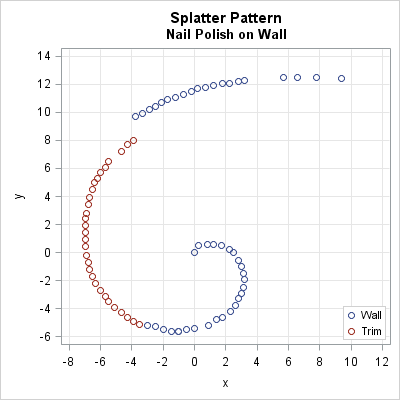
I printed out the photo and used a ruler to draw a grid of lines 1 centimeter apart across the page. I chose the origin to be a big blob of nail polish at the end of spiral, about 1/3 up from the bottom of the image. I then marked points at 5 mm intervals along the curve and read out the coordinates (to the nearest 1 mm) as my daughter typed them into SAS. The resulting coordinates are shown in the scatter plot. A large portion of the nail polish landed on the door-frame molding, which is raised 1.5 cm above the wall. That explains the apparent discontinuity in the upper left portion of the graph.
Create an objective function
To find the logarithmic spiral that best fit the data, you can minimize a function that computes the sum of the squared distances (in the radial direction) between the data and the predicted points along the spiral. Because the center of the spiral is unknown, you have fit four parameters: the center of the spiral (x0, y0) and the parameters a and b.
For given values (x0, y0), you can center the (x, y) coordinates by subtracting the coordinates of the center point. In a previous blog post, I showed how to obtain an increasing sequence of polar angles from the coordinates of (centered) data that are ordered along a parametric curve. Let θi be the polar angle that corresponds to the point (xi, yi). By using the fact that Euclidean and polar coordinates are related by x = R cos(θ) and y = R sin(θ), you can write down the predicted Euclidean coordinates of the logarithmic spiral:
ui = a cos(thetai) exp(b*thetai)
vi = a sin(thetai) exp(b*thetai)
The objective is therefore to minimize the radial distance between the predicted and observed values:
F(x0, y0, a, b) = Σi (xi-ui)2 +
(yi-vi)2
Fit a logarithmic spiral to the data
To optimize the function I decided to use the trust region method (the NLPTR call) in SAS/IML software, just as I did when fitting a circle to data. Based on the scatter plot, I guessed that the center was approximately (x0, y0) = (1, -1), and that a ≈ 26 and b ≈ -0.5.
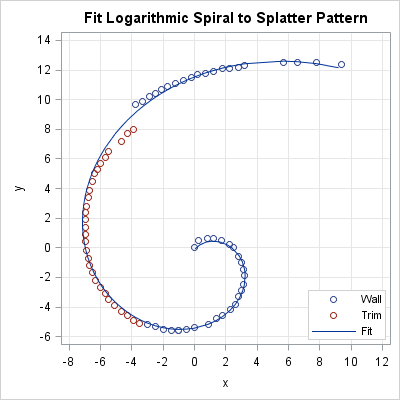
You can download the complete SAS program, which uses SAS/IML to optimize the parameters. The logarithmic spiral that best fits the data is shown overlaid on the scatter plot of the data. The curve fits remarkably well, with the obvious exception of the nail polish that splattered on the door frame (trim) instead of on the wall. If that section of data were moved upwards by 1–1.5 cm, then the fit would be even better. For the record, the parameter estimates are (x0, y0) = (0.69, -1.06), a = 22.34, and b = -0.35.
All models are wrong...including this one
As George Box famously said, "All models are wrong, but some are useful." However, this spiral model might be both wrong and useless.
I was so stunned by the appearance of this spiral on my wall that I didn't stop to think about whether a logarithmic spiral is a curve that can appear when a rotating bottle falls under the effects of gravity. The physics of falling objects is well understood.
Of course, I have no idea how the bottle was tumbling when it left my daughter's hands, nor do I know what angle the bottle was moving relative to the wall. Nevertheless, you can make some simplifying assumptions (bottle falling straight down, rotating in the horizontal plane as it falls,...) and compute the path that the nail polish would trace out in that simple situation. The physics-based model (not shown) also looks similar to the pattern on my wall. It's been a long time since freshman physics, and this is not a physics blog, so I invite the interested reader to download the SAS program and read my attempt to derive a physics-based model.
The main difference between the physics-based path and the logarithmic spiral is the function that is responsible for the radial decay of the spiral. In the logarithmic spiral, the decay function is the exponential function, which is a decreasing function that never reaches zero. In the physics-based model, the decay function is related to the distance between the bottle and the wall, which is a decreasing function that reaches zero in finite time. Any decreasing function will lead to a spiral, some of which have names. For example, a linear decreasing function is an Archimedean spiral.
I think that these data can be fit by many families of spirals because the bottle rotated only about 1.25 times before it hit the wall. To distinguish between the spirals, the data should show at least two full rotations so that the decay function can be more accurately modeled. However, no matter what model you choose, you can use the same optimization ideas to fit the parameters in the model.
To me it doesn't matter whether the spiral on my wall was logarithmic, Archimedean, or something else. It was cool to see, and I got to spend a little time talking about math with my daughter, which is a special treat. And, of course, I enjoyed the statistical modeling and SAS programming that I used to analyze these data.
Now I must stop writing. I have to paint that wall!

20 Comments
Math magic! What a wonderful and exciting experience...
Nice! However, regarding your current problem, since PROC REMOVE hasn't been introduced yet, you may want to take a look at: http://www.howtocleanstuff.net/how-to-remove-nail-polish-from-a-painted-wall/
Tried all of the above and more. After it dries, you are toast, and it dries very fast.
A prime example of "everyday math" and perhaps an unanticipated inspiration to encourage girls and STEM; however, with the caveat of "Do NOT Try This at Home"!
Brilliant story and good math. Thanks, Rick.
Who knew a tumbling nail polish bottle could create such a work of art -- and lead to a fun blog post about MATH? I bet you'd appreciate the rock tune “Lateralus,” based on the Fibonacci sequence: http://buff.ly/1Hj5E86
I never bothered to go figure out the details, but there's obviously some maths education in the Tool band members. How else would they come up with track titles like Cesaro Summability? :-)
Only a true mathophile would see spilled nail polish as a teachable moment. MATH is everywhere!
Wonderful story, Rick, thanks for sharing :-)
Some may like to see this in a math textbook; I'd like to see the story placed prominently in a handbook on parenting. For now, I'll just say: kid, I'm sure you know it already, but I'll remind you: you're really lucky to have such a Dad.
Nice job, one point is that the molding is closer to the bottle than the wall, hence the discontinuity. It may be possible to project the distance farther in the direction normal to the wall using the sin(theta)*r/r' where r' is the distance to the wall from the bottle and r is the distance to the molding from the bottle and theta is the angle formed by the triangle between the right angle to the wall and the hypotenuse from the bottle.
Personally, I would have made that spiral permanent as a memento, but other than that, one of the cutest endorsements of the love for parenthood and statistics I've read in a while. :)
I hope your daughter recovered from the "cruel and unusual punishment"....great blog post and use of a teachable moment!
Really liked this investigation - maths, physics, data and enthusiasm all together!
I see the physics model you used assumes a constant rotation and from this comes a non-exponential physics-based law - completely agree there is not enough data to tell which applies. But in fact an exponential component could enter the physics from the unstable gyroscopic motion of the tube of polish as it spins in the air. In rotational motion, a slightly distorted cylinder has two attractive stationary axes and one repulsive. If the tube's rotation axis happened to start close to one of these stationary axes, it would precess approximately exponentially towards or away, at least for the short time in the air.
So the exponential guess by eye may be the right physics as well but, with more degrees of freedom, this would need even more data to confirm it. And more mess to clean up.
Wowsers! I'm a high school math and physics teacher with a photo/artistic creative side... I never would have imagined such a spiral would show up like this! Great analysis... might just lead to some creative exploring and mathalyzing for next year's classes!!
I just have to ask - how old is the daughter?
She is a teenager: old enough to use nail polish and young enough to cry when it spills.
Simply astounding Rick! After reading the comments, not much more can be said.
Pingback: Popular posts from The DO Loop in 2015 - The DO Loop
Pingback: Your favorite SAS posts from 2015 - SAS Voices