In my article about how to create a quantile plot, I chose not to discuss a theoretical issue that occasionally occurs. The issue is that for discrete data (which includes rounded values), it might be impossible to use quantile values to split the data into k groups where each group has approximately the same number of elements. To put it bluntly, the algorithm that I proposed for creating a quantile bin plot can fail for large values of k.
The problem can occur for data that are rounded to the nearest unit, such as age, height, weight, and blood pressure. The algorithm assumes that the data quantiles are (mostly) unique and that they divide the empirical cumulative distribution function (ECDF) of N observations into k groups that each have approximately N/k observations. However, if there are more than N/k repeated values, the repeated value can occupy more than one quantile value. In fact, this will always happen if a particular value is repeated more than 2N/k times.
For example, suppose that you want to divide the diastolic blood pressure data in the Sashelp.Heart data set into 10 groups that each have approximately 10% of the data. The following statements draw the ECDF for the diastolic measurements and mark the deciles:
proc univariate data=Sashelp.Heart; var diastolic; cdfplot diastolic / vref=(10 to 90 by 10); ods select CDFPlot Quantiles; run; |
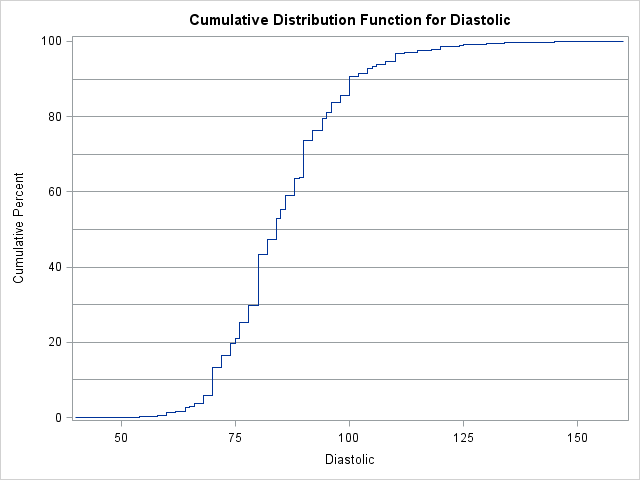
The value 80 appears in 711 of the 5209 observations, which is about 14% of the data. Notice that the value 80 intersects two reference lines, one at 30 and the other at 40. This means that 80 is both the 30th percentile and the 40th percentile. Assuming that you do not want to split the value 80 across two bins, the deciles of the data produce at most nine bins.
Another way to see this graphically is to use the RANK procedure to try to group the data into 10 groups, as described in the article "Grouping observations based on quantiles." The following statements create a new variable called Group, which for continuous data would have the values 0–9. However, for this rounded data only nine groups exist:
proc sort data=Sashelp.Heart out=Heart; by Diastolic; run; proc rank data=Heart out=Heart groups=10 ties=high; var Diastolic; /* variable on which to group */ ranks Group; /* name of variable to contain groups 0,1,...,k-1 */ run; proc sgplot data=Heart; scatter x=Group y=Diastolic / group=Group; refline 80 / axis=y; xaxis values=(0 to 9); run; |
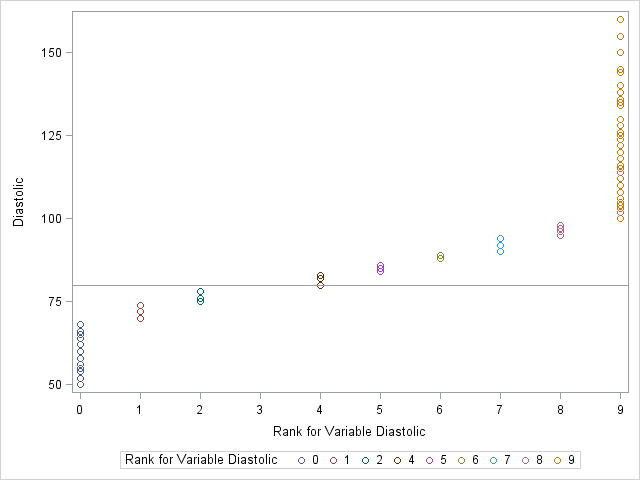
As shown by the legend on the scatter plot, only nine groups were created, instead of the 10 that were asked for. Group 3 was not created.
I've described a problem, but what can you do about it? Not a lot. The problem is in the data. If you are flexible about the number of groups, you can try decreasing the value of k. Because each group contains approximately N/k observations, decreasing k might circumvent the problem. Another possibility is to jitter the data by adding a small amount of random noise. That will eliminate the problem of repeated values.
So I'll leave you with this warning: beware of using quantiles to bin rounded data into groups. Although the technique works great when almost all of the data values are distinct, you can run into problems if you ask for many bins and your data contain many repeated values.

2 Comments
Pingback: How to use PROC HPBIN to bin numerical variables - The DO Loop
Pingback: The mystery of the density curve that was too short - The DO Loop