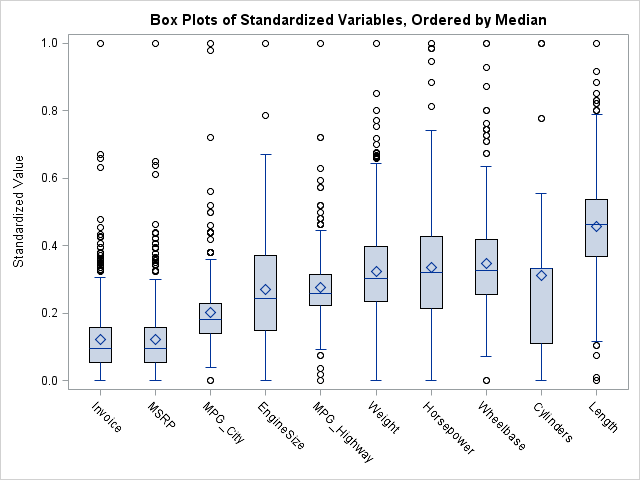
When I create a graph of data that contains a categorical variable, I rarely want to display the categories in alphabetical order. For example, the box plot to the left is a plot of 10 standardized variables where the variables are ordered by their median value. The ordering makes it apparent that the variables on the left (Invoice, MSRP) are highly skewed with many outliers, whereas the rightmost variable (length) appears to be symmetric and perhaps normally distributed.
When you use the SG procedures in SAS, there are several ways to change the order in which categories appear in a graph. One extremely powerful method is to use the DISCRETEORDER=DATA option on the XAXIS statement of the SGPLOT procedure. The DISCRETEORDER=DATA option tells the SGPLOT procedure to display the categories in the order in which they appear in the data set. In other words, if you can figure out some way to order the observations (DATA step, PROC SORT, PROC SQL,....), then you will see that same order when you create a graph of the data.
To illustrate this idea, let's create the box plot at the top of this article. The data are standardized versions of the numerical variables in the Sashelp.Cars data set. The statistic of interest is the median. The following statements create the data and compute the medians:
%let DSName = sashelp.cars; %let Stat = Median; /* or mean, stddev, qrange, skew, etc */ /* standardize variables to [0,1] */ proc stdize method=range data=&DSName out=MyData; run; proc means data=MyData &Stat STACKODSOUTPUT; ods output Summary=StatOut; run; |
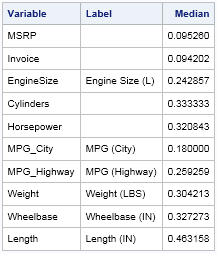
The ODS OUTPUT statement is used to create a data set with the median statistic for each variable. The STACKODSOUTPUT option is used so that the output data set has the same structure as the printed table.
The next step is to get the list of variables ordered by the median statistic. My favorite method is to use PROC SQL's useful SELECT INTO :MACROVAR syntax. I thank my colleague Gordon for reminding me I do not need to use PROC SORT to sort the variables, I can use the ORDER BY clause in PROC SQL instead.
/* put ordered variable names into macro variable */ proc sql noprint; select Variable into :varlist separated by ' ' from StatOut order by &Stat; quit; |
The macro variable &VARLIST now contains a list of the variables, ordered by their medians. In order to create a single graph that has multiple box plots, transpose the data from wide form (many varables) to long form (two variables that specify the variable name and value). The following statements add an "observation number" variable to the data and use the RETAIN statement to reorder the variables. Then PROC TRANSPOSE converts the data set from wide form to long form. In the Long data set, the variable names are ordered by the value of the statistic. (Alternatively, you could merge the statistics and the original data and then sort the merged data by the statistic and the observation number.)
data Wide / view=Wide; retain &varlist; /* reorder vars by statistic */ set MyData; obsNum = _N_; /* add ID for subject (observation) */ keep obsNum &varlist; run; /* transpose from wide to long data format; VARNAME is a categorical var */ proc transpose data=Wide name=VarName out=Long(rename=(Col1=_Value_) drop=_LABEL_); by obsNum; run; |

Data in this form is ideal for graphing by using SGPLOT statements that support a GROUP= or CATEGORY= option. To create the graph at the beginning of this article, use the VBOX statement with the CATEGORY= option. If you also use the DISCRETEORDER=DATA option on the XAXIS statement, the box plots are ordered by their median values, as shown in the following:
title "Box Plots of Standardized Variables, Ordered by &Stat"; proc sgplot data=Long; label _Value_ = "Standardized Value" VarName="Variable"; vbox _Value_ / category=VarName; xaxis discreteorder=data display=(nolabel); /* respect ordering */ run; |
Obviously, you can use this same technique to create box plots that are ordered by other statistics.
What technique do you use to order groups or categories in a graph? Can you think of applications for which this technique would be useful? Leave a comment.

3 Comments
Pingback: An exploratory technique for visualizing the distributions of 100 variables - The DO Loop
Pingback: Specify the order of variables at run time in SAS - The DO Loop
Pingback: Perceptions of probability - The DO Loop