A challenge for statistical programmers is getting data into the right form for analysis. For graphing or analyzing data, sometimes the "wide format" (each subject is represented by one row and many variables) is required, but other times the "long format" (observations for each subject span multiple rows) is more useful. I've previously written about how to reshape data from wide to long format.
It can be a challenge to get data in the right shape. For years I have wrestled with reformatting output data sets when computing descriptive statistics for multiple variables. One of the powers of SAS software is that you can specify many variables in a procedure (such as MEANS or UNIVARIATE) and the procedure computes the requested statistics for each variable. However, to use that output in a subsequent graph or analysis sometimes requires reshaping the output data set.
Since it is inconvenient to have to reshape data sets, this article describes three ways to produce descriptive statistics (in particular, percentiles) in a tabular form in which variables form columns (or rows) and the statistics are arranged in the other dimension. This is usually the easiest shape to work with.
For standard percentiles, use PROC MEANS
As a canonical example, consider the the task of computing multiple percentiles for several variables when the underlying data are in a wide format. By default, both PROC MEANS and PROC UNIVARIATE create the output data set in a less-than-optimal shape.
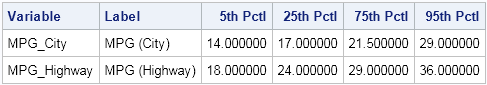
For commonly used percentiles (such as the 5th, 25th, 50th, 75th, and 95th percentiles), you can use PROC MEANS and the STACKODSOUTPUT option, which was introduced in SAS 9.3, to create an output data set that contains percentiles for the multiple variables in a more convenient format. Compare the following two output data sets. The first output is usually harder to work with than the second:
/* default output data set. Yuck! */ proc means data=sashelp.cars noprint; var mpg_city mpg_highway; output out=MeansWidePctls P5= P25= P75= P95= / autoname; run; proc print data=MeansWidePctls noobs; run; |

/* Use the STACKODSOUTPUT option to get output in a more natural shape */ proc means data=sashelp.cars StackODSOutput P5 P25 P75 P95; var mpg_city mpg_highway; ods output summary=LongPctls; run; proc print data=LongPctls noobs;run; |
If I want to use the percentiles in a subsequent analysis, such as plotting the percentiles on a graph, I much prefer to work with the second set of output.
For nonstandard percentiles, use PROC STDIZE
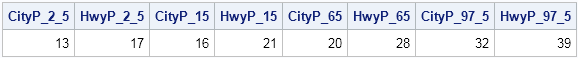
For many years I have used PROC UNIVARIATE to compute custom percentiles. One application of custom percentiles is to compute a 95% bootstrap confidence interval, which requires computing the 2.5th and 97.5th percentiles. However, when you are analyzing multiple variables PROC UNIVARIATE creates an output data set that is a single row, as shown in the following example:
/* default output data set. Yuck! */ proc univariate data=sashelp.cars noprint; var mpg_city mpg_highway; output out=UniWidePctls pctlpre=CityP_ HwyP_ pctlpts=2.5,15,65,97.5; run; proc print data=UniWidePctls noobs; run; |
There are many tricks, papers, and macros published that reshape or restructure the output from PROC UNIVARIATE. In my book, Simulating Data with SAS, I show one technique for reshaping the output. (If you have a favorite method, link to it in the comment section.)
And so it was a surprise to find out that the easiest way to get customized percentiles in a tabular form is to not use PROC UNIVARIATE! It turns out that the STDIZE procedure also computes custom percentiles, and the output is written in a tabular form. I knew that PROC STDIZE standardizes variables, but I didn't know that it computes custom percentiles.
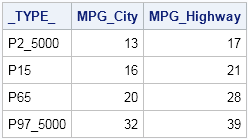
The PROC STDIZE syntax is easy and very similar to the PROC UNIVARIATE syntax: use the PCTLPTS= option to specify the custom percentiles. Unlike PROC UNIVARIATE, you do not need PCTLPRE= option, because the names of the variables are used for the output variables, and the percentiles are just additional rows that are added to the output data set. A typical example follows:
proc stdize data=sashelp.cars PctlMtd=ORD_STAT outstat=StdLongPctls pctlpts=2.5,15,65,97.5; var mpg_city mpg_highway; run; proc print data=StdLongPctls noobs; where _type_ =: 'P'; run; |
I explicitly specified the PCTLMTD= option so that the algorithm uses the traditional "sort the data" algorithm for computing percentiles, rather than a newer one-pass algorithm. Although the one-pass algorithm is very fast and well-suited for computing the median, it is not recommended for computing extreme percentiles such as the 2.5th and 97.5th.
Or use the SAS/IML language
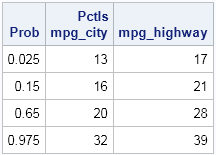
Of course, no blog post from me is complete without showing how to compute the same quantity by using the SAS/IML language. The QNTL subroutine computes customized quantiles. (Recall that quantiles and percentiles are essentially the same: The 0.05 quantile is the 5th percentile, the 0.25 quantile is the 25th percentile, and so forth.) By using the QNTL subroutine, the quantiles automatically are packed into a matrix where each column corresponds to a variable and each row corresponds to a quantile, as follows:
proc iml;
varNames = {"mpg_city" "mpg_highway"};
use sashelp.cars;
read all var varNames into X;
close sashelp.cars;

Prob = {2.5, 15, 65, 97.5} / 100;   /* prob in (0,1) */
call qntl(Pctls, X, Prob);
print Prob Pctls[c=varNames]; |
So there you have it. Three ways to compute percentiles (quantiles) so that the results are shaped in a tabular form. For standard percentiles, use PROC MEANS with the STACKODSOUTPUT option. For arbitrary percentiles, use PROC STDIZE or PROC IML. If you use these techniques, the percentiles are arranged in a tabular form and you do not need to run any additional macro or DATA step to reshape the output.

14 Comments
Hello,
Many thanks - this PROC STDIZE tip is really simple/useful.
Is there a way to get 95% confidence intervals about the percentile estimates?
John
Yes, you can use the CIPCTLDF option on the PROC UNIVARIATE statement, which produces distribution-free confidence interals.
Suppose I want to calculate specific percentiles of multiple variables excluding 0 values or some other condition using where statement; how can I do that in single procedure; instead of repeating same procedure over and over.
proc means data=sashelp.cars StackODSOutput P5 P25 P75 P95;
var mpg_city ;
where mpg_city >0 ;
ods output summary=LongPctls;
run;
proc means data=sashelp.cars StackODSOutput P5 P25 P75 P95;
var mpg_hwy ;
where mpg_hwy >0 ;
ods output summary=LongPctls;
run;
You can ask questions like this at the SAS Support Communities. Be sure to mention what SAS products you have available. The short answer is you can't do it with a WHERE clause because a WHERE clause removes an entire observation whereas you are asking for a univariate filter for each variable. You can achieve your objective by a two-step process: replace all values <= 0 by a missing value, then use the procedures in this blog post to compute the percentiles. However, in general it is not advisable to excluding part of your data, so the better approach is to explain in the Community what you are trying to accomplish.
Very useful article!
How to find 95 percentile in grouping variables.
Like Branch wise 95 percentile.
Pingback: Automate the placement of reference lines in PROC SGPLOT - The DO Loop
is there a way to get Median in proc means with out using output statement in a dataset?
You can use the MEDIAN option on the PROC MEANS statement. If that doesn't answer your question, you can ask questions, post data, and have discussions on the SAS Support Communities.
Thanks for this. Is there a way to save the percentile output values as parameters that can be accessed by another PROC?
See https://blogs.sas.com/content/iml/2017/01/09/ods-output-any-statistic.html
What if I want to print the first 90 percentile of my data set?
1) Find the 90th percentile. Let's pretend the 90th percentile for your data is 57.3.
2) Use a WHERE clause in PROC PRINT to display only observations whose values are less than that value:
If you have additional questions, you can ask them on the SAS Support Community.
Thanks, @Rick for your help, '