SAS provides several ways to compute sample quantiles of data. The UNIVARIATE procedure can compute quantiles (also called percentiles), but you can also compute them in the SAS/IML language. Prior to SAS/IML 9.22 (released in 2010) statistical programmers could call a SAS/IML module that computes sample quantiles. With the release of SAS/IML 9.22, there is now a built-in QNTL call for computing sample quantiles.
Computing quantiles
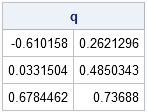
The QNTL call computes the samples quantiles for each row of a matrix. By default the 0.25, 0.5, and 0.75 quantiles are computed. (These are the 25th, 50th, and 75th percentiles, respectively.) The following statements compute sample quantiles for a matrix whose first column is from a standard normal distribution and whose second column is from a standard uniform distribution:
proc iml; N = 1000; /* sample size */ u = j(N,1); z = j(N,1); /* allocate vectors */ call randseed(1); call randgen(u, "Uniform"); call randgen(z, "Normal"); x = z || u; /* concatenate into 1000 x 2 matrix */ call qntl(q, x); /* by default, compute Q1, median, and Q3 */ print q; |
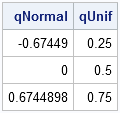
The output shows that the sample quantiles of the columns are close to the theoretical quantiles for the underlying populations, as shown by the following statements:
/* compute quantiles of distributions */
qNormal = quantile("Normal", {0.25, 0.5, 0.75});
qUnif = quantile("Uniform", {0.25, 0.5, 0.75});
print qNormal qUnif; |
Notice that sample quantiles of data are computed by using the QNTL call, but theoretical quantiles of a "named" distribution are computed by using the QUANTILE function in Base SAS.
Computing other quantiles
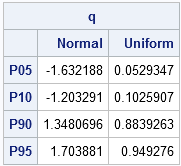
The QNTL call supports a third parameter with which you can specify specific quantiles. For example, the following statements compute the 5th, 10th, 90th, and 95th quantiles of each column of x:
p = {0.05, 0.10, 0.90, 0.95};
call qntl(q, x, p); /* compute 5th, 10th, 90th, and 95th quantiles */ |
Labeling quantiles
The output from the QNTL call is a matrix, q. The number of columns of q is the number of n columns of x, and each row represents a quantile. If you want to display the quantiles, it is convenient to use the CHAR function or the PUTN function to form row labels that indicate the quantiles or percentiles, as shown in the following statements:
labels = "P" + putn(100*p, "Z2."); /* concat "P" and {"05" "10" "90" "95"} */
varNames = {"Normal" "Uniform"};
print q[rowname=labels colname=VarNames]; |
As shown in the example, the Zw.d format can be useful for converting the numerical quantiles to percentile labels.

1 Comment
Pingback: Bin observations by using custom cut points and unevenly spaced bins - The DO Loop