I recently blogged about how many times, on average, you must roll a die until you see all six faces. This question is a special case of the coupon collector's problem. My son noted that the expected value (the mean number of rolls) is not necessarily the best statistic to use to answer the question. For our experiment, the median number of rolls was a better estimate for the "typical" number of rolls.
However, I don't know how to compute the expected median number of rolls for this problem. Fortunately, I do know how to simulate the experiment, and I can estimate the median from the simulation.
Time-to-Event Simulations
This is a "time-to-event" problem: you need to simulate the number of rolls until some event occurs. In this case, the "event" is the first appearance of the sixth face. When I write a simulation, I often estimate the probability density function (PDF), which in this case is a bar chart of the proportion of trials for which the event happened on the nth roll. However, for this problem it makes more sense to simulate the cumulative distribution function (CDF), which contains the same information but also clearly shows the median value. (In the language of survival analysis, the time to event is known as the "survival time," and the CDF is related to the "survival curve.")
The first step in writing a time-to-event simulation is to decide whether each (simulated) trial needs to run to completion, or whether you will fix the length of the trial. If you fix the length, then for some trials the event will not occur. (The survival time is said to be censored for that trial.)
I'm going to set an upper limit to the number of trials. I could set the upper limit based on my son's experiment (the largest number of rolls was 26), but that value is tied to the fact that we rolled a die with six sides. I want the simulation to work for the coupon collector's problem with K coupons, so I'll use a little probability theory. You can look up formulas for the mean and variance of the survival time as a function of K. For my simulation, I will use L = mean + 2*StdDev as the maximum number of rolls in each trial. When K=6, L is 41. The following SAS/IML statements set the number of rolls per trial:
/** simulate coupon collector problem
    with equal probabilities **/
proc iml;
K = 6; /** number of coupons **/
mean = sum(K/(1:K));
p = repeat(1/K, K);
StdDev = sqrt( sum( (1-p)/p##2 ) );
L = floor(mean + 2*StdDev); /** max rolls per trial **/ |
Simulate the Trials
As is usually the case, you can generate all of the random rolls in a single SAS/IML call by using the RANDGEN subroutine. First allocate a matrix with NSim rows and L columns. Then fill up each element with a random integer in the interval [1, K]:
/** generate NSim trials of L rolls **/ NSim = 10000; x = j(Nsim, L); call randseed(12345); call randgen(x, "Uniform"); x = ceil(K*x); /** integers in [1,K] **/ |
Each row of x is a trial. You can detect whether the event has occurred on the jth roll by counting the number of unique values in the first j columns of the row. (The COUNTUNIQUE function, which is available in SAS/IML 9.22, performs this task.) If that number is K, then all the possible coupons (faces) have been seen, and the event has occurred. The empirical CDF for this simulation is the proportion of rows for which the event has occurred, as a function of the columns, j = K, K+1, ..., L. Consequently, the following statements compute the empirical CDF:
/** has event occurred by roll j? (j=K..L) **/ cdf = j(L,1,0); /** allocate **/ do j = K to L; c = countunique(x[,1:j], "row"); cdf[j] = (c=K)[:]; end; |
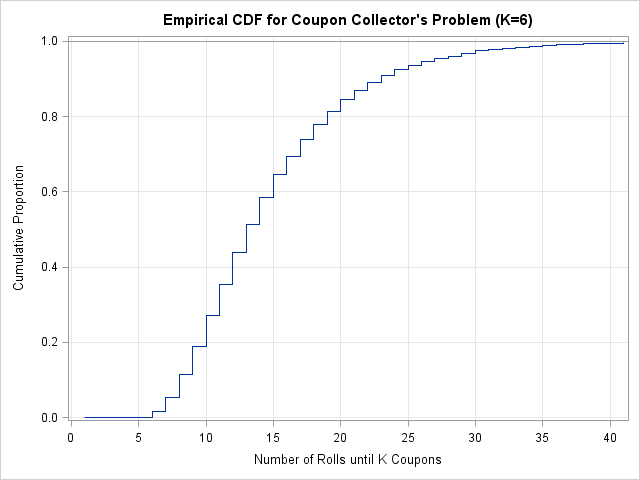
Notice that you can estimate the median directly from the CDF, because (for a continuous random variable) the median is the value of x for which CDF(x) = 0.5. The random variable in this problem is discrete, but 51% of the time all six faces occur by the 13th roll.
By the way, if you want to see the empirical probability density function (pdf), you can get it directly from the CDF: pdf = cdf[K:L] - cdf[K-1:L-1].
Remark: Dale McLerrin posted a detailed comment about how to use combinatorics and a simulation (using the DATA Step) to solve this problem.

3 Comments
Pingback: How many times must you roll a die until each side has appeared? - The DO Loop
Pingback: Stirling numbers in SAS - The DO Loop
Pingback: Birthdays and the coupon collector's problem - The DO Loop