One of the advantages of the new mixed-type tables in SAS/IML 14.2 (released with SAS 9.4m4) is the greatly enhanced printing functionality. You can control which rows and columns are printed, specify formats for individual columns, and even use templates to completely customize how tables are printed. Printing a table is accomplished by using the TablePrint subroutine, which has many more options than the well-known SAS/IML PRINT statement for matrices.
The TablePrint subroutine
The TablePrint subroutine provides many options that give you control over the output:
- The FIRSTOBS= and NUMOBS= options specify the range of observations to print.
- The ID= option specifies a variable to use for the row header on the left side of the table.
- The VAR= option specifies the columns (and the column order) for the table.
- The LABEL= option specifies a spanning header for the table.
For example, the following DATA step creates random birthdays for the students in the Sashelp.Class data set. The Birthday variable is formatted with the DATE9. format. The data is then read into a SAS/IML table by using the TableCreateFromDataSet function. Finally, the TablePrint subroutine prints a customize portion of the table:
data class; set sashelp.class; Birthday = '03APR2017'd - age*365 - floor(365*uniform(1)); /* create birthday */ format Birthday DATE9.; run; proc iml; tClass = TableCreateFromDataSet("Class"); /* read data into table */ run TablePrint(tClass) firstobs=3 numobs=5 var={"Age" "Birthday"} ID="Name" label="Subset of Class"; |
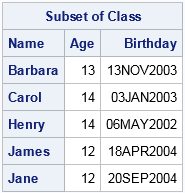
Notice that the table contains both numeric and character columns. Furthermore, the numeric columns have different formats. The TablePrint subroutine has some distinct advantages over the traditional PRINT statement in SAS/IML:
- The TablePrint subroutine supports an easy way to display a range of observations. When you use the PRINT statement for multiple vectors, you have to use row subscripts in each vector, such as PRINT (X[3:8,]) (Y[3:8,]);
- The TablePrint subroutine supports printing any columns in any order. When you use the PRINT statement on a matrix, you have to use column subscripts to change the order of the matrix columns: PRINT (X[, {2 3 1}]);
- The PRINT statement supports the ROWNAME= option (for specifying row headers), the COLNAME= option (for specifying column headers), and the LABEL= option. Those options are easy to work with when you print a single matrix. However, you can't store mixed-type data in a matrix and those options are less convenient when you print a set of vectors.
Advanced printing of SAS/IML tables
The SAS/IML documentation has several sections of documentation devoted to advanced printing of SAS/IML tables. For example, you can use the TablePrint subroutine to do the following:
- Use a custom template to display a table.
- Specify values for dynamic variables in templates.
- Use an existing ODS template to format and display data that are in SAS/IML.
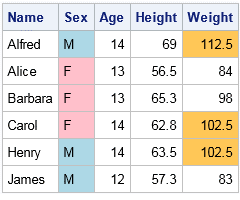
The documentation contains an example of "traffic lighting," where the colors of cells depend on the value in the cells, as shown to the right.
For statistical programmers, the ability to use ODS templates means that output from PROC IML can look the same as output from some other SAS procedue. For example, suppose that you have a table that contains parameter estimates for a linear regression. The following example prints that table by using the same ODS template that PROC REG uses, which is the Stat.Reg.ParameterEstimates template:
proc iml; vars = {"Intercept", X, Z}; stats = {32.19 5.08 21.42 42.97, 0.138 0.0348 0.0644 0.2117, 1.227 0.5302 0.1027 2.3506 }; tbl = TableCreate("Variable", vars); call TableAddVar(tbl, {"Estimate" "StdErr" "LowerCL" "UpperCL"}, stats); Confidence=95; call TablePrint(tbl) template="Stat.Reg.ParameterEstimates" dynamic={Confidence}; |
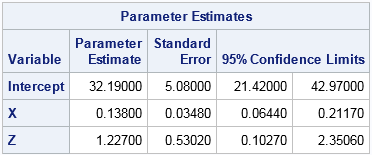
This example works because the column names in the SAS/IML table match the names that are expected by the Stat.REG.ParameterEstimates template. The DYNAMIC= option specifies a dynamic variable (Confidence) that the template requires. See the documentation for further details.
Summary
In summary, the TablePrint subroutine in SAS/IML gives programmers control over many options for printing tables of data and statistics. For complex layouts, you can use an existing ODS template or create your own template to customize virtually every aspect of your tabular displays. For more information about SAS/IML tables, see the SAS Global Forum paper "More Than Matrices" (Wicklin, 2017).

6 Comments
So, Rick, I complain about this every chance I get.
All I know about what version of SAS I have is that the About SAS 9 selection under the Help menu says I have SAS 9.4 TS Level 1M2. I have no idea if I have SAS/IML 14.2, and I don't even know where to look for that information, nor do I care. I would request that in the future, all SAS authors use the maintenance release in addition to the version SAS/IML 14.2, so that those of us who don't have all of this information memorize can determine if we have the right version of SAS by going to the Help->About SAS 9 menu command.
So could you please clear this up? What maintenance release do I need to get SAS/IML 14.2??
Thanks for the reminder. I often include the maintenance release in my posts, but omitted it in this one.
SAS/IML 14.2 was released as part of SAS 9.4m4. The article "How old is your version of SAS? Release dates for SAS software" shows the relationship between calendar dates, analytical releases, and Base SAS releases. I update that post after every release, so it is always up-to-date. You can use it to discover that your version of SAS 9.4m2 corresponds to the 13.2 release of the SAS Analytical products (SAS/STAT, SAS/ETS, SAS/IML, etc).
Pingback: Video: Create and use lists and tables in SAS/IML - The DO Loop
Pingback: Print the top rows of your SAS data - The DO Loop
Hi Rick, It is probably a trivial problem but I need some help, and I am sure it is a small think for you.
I have a proc iml code ending at providing me some estimated value stored into a column of length nsims (no. of simulations, say 100). Each run line gives me one such col of 100 rows. I want to collect outputs of all runs into a matrix; say 10 run lines (pertaining to different parameters, e.g. sample sizes), and I want to get one table of nsims rows and 10 columns. How do I get it?
Thanks in anticipation
Ralf
You are asking for the results in "wide form" (10 cols), but it is probably better to use long form (10 sets of 100 rows, one for each parameter. To get long form, put the APPEND statement inside the loop over the the 10 parameter values. See "Write to a SAS data set from inside a SAS/IML loop."
If you really want 10 columns, then allocate
results = j(nsims, 10);
and assign the vectors for the i_th parameter to results[,i].
If that doesn't answer your question, post your question to the SAS IML Support Community.