I still remember the first time I was asked to "consult" on a statistical problem. A former physics professor had some students who had gathered data that should lie along an arc of a theoretical circle. The professor asked if there was a regression technique that could find the center and radius of the circle that best fits the data.
After thinking about the problem, I sent him a method that the students could use to fit a circle to their data. The method differs from an ordinary regression in one important way. In the familiar least squares regression, you minimize the sum of the squares of the vertical distance between the observed Y values and the predicted Y values, where the prediction is a function of observed X values. For fitting a circle to data, you want to minimize the sum of the squares of the radial distances.
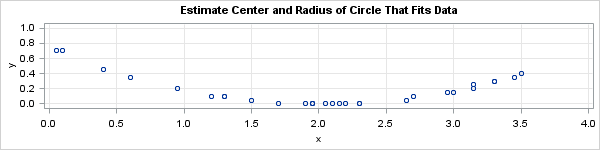
I have long since lost the sheet of paper that contained the real data, but the following made-up data is similar to what I remember. The scatter plot at the top of this article shows that the points seem to lie along the arc of a circle.
data Circle; input x y @@; datalines; 2.1 0 1.3 0.1 0.95 0.2 1.7 0 0.1 0.7 0.4 0.45 1.3 0.1 0.6 0.35 1.95 0 2.65 0.05 2.7 0.1 2.95 0.15 1.2 0.1 3.5 0.4 1.5 0.05 1.95 0 3.3 0.3 3.45 0.35 2.3 0 2.15 0 2.05 0 3.15 0.2 1.9 0 3.15 0.25 1.95 0 2.3 0 3.3 0.3 0.05 0.7 2.2 0 3 0.15 ; ods graphics / width=600px height=150px; title "Estimate Center and Radius of Circle That Fits Data"; proc sgplot data=Circle; scatter x=x y=y; xaxis grid values=(0 to 4 by 0.5); yaxis grid values=(0 to 1 by 0.1); run; |
The goal of this article is to show how find the center and radius of the circle that best fits the data by using an optimization approach. I do not claim to have invented this method, and I'm sure that there are other ways to do this computation.
Defining the objective function
You can define the "circle of best fit" as the circle that minimizes the radial distances between the data and the circle. Consider a circle with radius R
and center (x0, y0).
If
{(x1, y1), ...,
(xn, yn)} are the observed ordered pairs, then the goal is to minimize the following function, which computes the sum of the squared differences between data and the circle:
F(x0, y0, R) = Σi [ (xi-x0)2 +
(yi-y0)2 - R2 ]2
You could also insert a square-root sign and compute the difference between R and the distance to the center. My formulation leads to simpler computations of partial derivatives, which I leave as an exercise.
Obviously this function reaches a minimum when the partial derivatives with respect to the parameters vanish. If you set the partial derivative ∂F/∂R equal to zero, you discover that the best-fit circle has a squared radius that is the mean of the squared distances from the data to the center of the circle. In symbols, the optimal R value satisfies
R2 = (1/n) Σi
(xi-x0)2 +
(yi-y0)2.
Thus the problem reduces to a minimization over two parameters. You can use the nonlinear optimization methods in SAS/IML to solve this minimization problem for a given set of data. The following statements define the objective function. (Notice that the GLOBAL statement is used to access the data.) Based on the scatter plot of the data, I provided an initial guess of (x0, y0) = (2.5, 5). In previous blog posts, I have used Newton-Raphson optimization (the NLPNRA call) for the optimization, so for a change of pace I will use a trust region method (the NLPTR call) to solve this problem.
proc iml;
start ObjF(p)  global(x, y);    /* x and y are fixed vectors of data */
   x0 = p[1];  y0 = p[2];       /* parameters to optimize */
   d2 = (x-x0)##2 + (y-y0)##2;  /* vector of distances from pts to center */
   R2 = mean(d2);               /* square of optimal radius */
   F = ssq(d2 - R2);            /* minimize F = SSQ differences */
   return(F);
finish;

use Circle;  read all var {x y};  close Circle;  /* read observed data */

p = {2.5 5};                           /* initial guess for (x0, y0) */
opt = {0 1};                           /* options=(min, print level) */
call nlptr(rc,result,"ObjF", p, opt);  /* find optimum (x0, y0) */
x0 = result[1]; y0 = result[2];
R2 = mean( (x-x0)##2 + (y-y0)##2 );    /* compute optimum R##2 */
ParamEst = x0 || y0 || sqrt(R2);
print ParamEst[c={"x0" "y0" "R"} label="Parameter Estimates"]; |
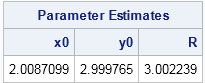
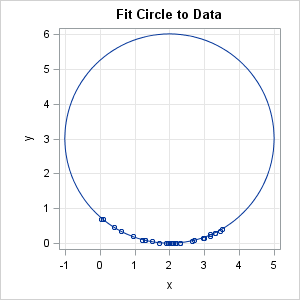
For these data, the circle of best fit has center (2, 3) and radius 3. The following scatter plot overlays the optimal circle on the data:
As with many nonlinear optimization problems, it is important to use a good starting guess. For the data in this example, the solution seems to be robust to poor initial guesses. However, for some distributions of the data, there might be multiple local optima.

9 Comments
And here's a way to do this by using PROC OPTMODEL in SAS/OR:
Hi,
Have you investigated the moments of the three parameter estimates: a, b and R?
Regards
Jon
Interesting question. This process can lead to parameter estimates that have no moments.
Yeah, I think Jon is right . If there are some outliers , your fitted circle would not look good . In other words, Rick's method is not robust .
It's a least squares method, so of course it is not robust to outliers.
Rick,
If you replace MEAN with MEDIAN ,would be better.
Adding to the fun:
*--- SAS/OR ---;
proc nlp data=circle;
parms x0 = 0, y0 = 0, R = 1;
bounds R >= 0;
delta = ( (x - x0)**2 + (y - y0)**2 - R**2 ) **2;
min delta ;
run;
*--- SAS/STAT ---;
proc nlin data=circle converge=1e-6;
parms x0 = 0, y0 = 0, R = 1;
bounds R >= 0;
delta = ( (x - x0)**2 + (y - y0)**2 - R**2 ) **2;
model zero = delta;
run;
zero is a column of 0's to satisfy nlin syntax. Cheers.
Rick,
I found another interest PROC to perfectly fit these data either .
代码: 程序
ods graphics on;
proc loess data=CIRCLE ;
model y= x/ clm residual;
run;
Any parametric or nonparametric regression procedure can fit these data for Y as a function of X, but those models will minimize the VERTICAL distance between the observed and predicted Y values. The goal of this post is to minimize the RADIAL distances. If the data were distributed across the entire circumference of a circle, the regression procedures would not work at all.