I sometimes wonder whether some functions and options in SAS software ever get used. Last week I was reviewing new features that were added to SAS/IML 13.1. One of the new functions is the CV function, which computes the sample coefficient of variation for data.
Maybe it is just me, but when I compute descriptive statistics for univariate data, the coefficient of variation is not a statistic that I look at. I don't think my undergraduate statistics course even mentioned the coefficient of variation (CV). I first encountered the idea many years later when learning about distribution theory.
The CV is a simple idea. For a distribution, the coefficient of variation is the ratio of the standard deviation to the mean: CV = σ/μ. You can estimate the coefficient of variation from a sample by using the ratio of the sample standard deviation and the sample mean, usually multiplied by 100 so that it is on the percent scale. This ratio is also known as the relative standard deviation when the data are positive.
What does the coefficient of variation mean?
The coefficient of variation is a dimensionless quantity. As such, it provides a measure of the variability of a sample without reference to the scale of the data.
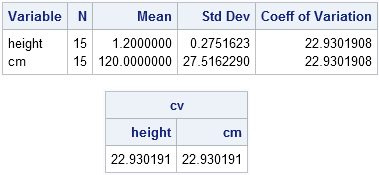
Suppose I tell two people to measure the heights of some plants. The first person reports that the average height is 1.2 meters, with a standard deviation of 0.275 meters. The second person measures the same plants in centimeters. She reports that the average height is 120 centimeters, with a standard deviation of 27.5 centimeters. Obviously, these are the same answers, but one person reports a standard deviation of 0.275 (which sounds small) whereas the other person reports a standard deviation of 27.2 (which sounds big). The coefficient of variation comes to the rescue: for both sets of measurements the coefficient of variation is 22.9.
The CV can also help you compare two completely different measurements. How does variation in height compare to variation in weight? Or age? Or income? These variables are measured on different scales and use different units, but the CV (which is dimensionless) enables you to compare the variation of these variables.
How to compute the coefficient of variation in SAS
The coefficient of variation is computed by several SAS procedures: MEANS, UNIVARIATE, IML, TABULATE, and so forth. The following example shows data for the plant measurement example in the previous paragraph. The MEANS and IML procedure compute the CV for measurements on the meter and centimeter scales:
data Plants; input height @@; cm = height * 100; datalines; 1.6 1.5 .8 1.0 1.2 .9 1.2 1.8 1.2 1.3 1.3 .9 1.2 1.0 1.1 ; proc means data=Plants N mean std cv; run; proc iml; use Plants; read all var _NUM_ into X[c=varNames]; close; cv = cv(X); print cv[c=varNames]; |
Theoretical uses of the coefficient of variation
The coefficient of variation has some interesting uses as a theoretical tool. It enables you to compare the variation between different probability distributions. As I mentioned in my article on fat-tailed and long-tailed distributions, the exponential distribution is an important reference distribution in the theory of distributions. Because the standard deviation and the mean of an exponential distribution are equal, the exponential distribution has a CV equal to 1. Distributions with CV < 1 are considered low-variance distributions. Distributions with CV > 1 are high-variance distributions.
Obviously the coefficient of variation is undefined when μ = 0, such as for the standard normal and t distributions, which perhaps explains why the CV is not more widely used. The sample CV is undefined for centered data and is highly variable when the population mean is close to zero.
Do you use the coefficient of variation?
Have you ever used the coefficient of variation in a real data analysis problem? Is the CV a useful but underutilized statistic for practical data analysis? Or is it primarily a theoretical tool for comparing the variability of distributions? Leave a comment.

19 Comments
I use it quite a bit in real estate analysis, for example deciding which unit of measure to use comparing a group of sales. Looking at say a group of apartment sales it is a quick way to examine them by sale price per apartment vs sale price per square foot, or on land sales between something like lake frontage or square footage.
I saw it used to characterize the variability of the solution times for a mixed-integer optimization solver on a set of test instances. The solver was run with different random seeds and each produced a run with a different run time. This test was run for a lot of instances, which themselves took a very different time to solve. CV was a good way to get a quantity that can be compared even if the mean solution times are different.
I've used it; I find it to be a nice summary statistic especially for people who don't want to look at density plots and so on.
However, if I were writing a function that I wanted people to use (and some of those people might not be statisticians or be all that careful) I'd put in error messages if any of the data points were negative. In such a case the CV is meaningless (and often misleading).
E.g -3, -2, -1, 0, 1, 2, 3 the CV is infinite.
But you've given me an idea for a blog post.
Many practitioners recommend using CV only for data on a "ratio scale."
But it is not the negative values that cause the problem in your example, it is the fact that the sample mean is zero.
Many other sample statistics become infinite for special data sets. For example, a set of constant values has zero variance, which means that z-score, skewness, and kurtosis are ill-defined.
The CV is a great metric that should and deserves to see wider use. It has had its ups and downs in finance. As you note, it facilitates direct, scale-free comparison of the volatility or risk in differently priced stocks. So, in comparing a stock with an average price of $500 and an SD of $100 vs a stock averaging $5 with an SD of $0.50, the SDs tell you nothing re that comparison...but the CV does. CVs became the subject of intense scrutiny about the time that algorithmic stock trading and high frequency data began to see wide use on the Street. That said, the institutionalization of CV-based indexes, leading indicators or ARCH-/GARCH-type models that try to identify SD regimes have yet to be developed...as far as I know that is.
I was using it just the other day as a heuristic to track volatility regimes in time series of the Yield Curve (the YC is the single best metric I know for predicting market crashes in the US)...but then I am always looking for ways to apply the CV....
I analyze data on a daily basis and have never used it. In fact I am still fuzzy on what it communicates.
Everything has its use in an appropriate setting, I guess it all depends on what it is you are trying to understand about the problem. I work for a bank, a lot of analysis is on skewed data, e.g., majority of wealth is concentrated in the hands of a small minority, the interest isn't in understanding the volatility and it isn't symmetric anyway, so I have never needed to use CV in my work for decades.
Wow, I never thought I'd see someone blog about one of my favorite, albeit boring, statistics! As a consulting statistician with a very broad client base, I use the CV a lot. All too often my advice is sought out after the data are collected, so I don't initially know much about the variables. I find CV a helpful initial step in data cleaning. You get to see relative variability across many variables at once. Did the client expect a particular variable to have way more variability than the rest? If not, let's figure out what happened before we go much further.
Another favorite set of "statistics" is PROC UNIVARIATE's (or R's Hmisc describe function's) five largest and smallest values. You don't have to know anything about the data to know that when the top five values are: 95, 97, 98, 99, 977 that there's bad data.
I've used both of those countless times to help people who are stuck in very complex analyses as a result of having skipped the basics.
I had to laugh reading this. The only time I use it is when I'm teaching statistics and explain what it is to students. Then I forget about it again. I feel remiss. Will look at CV in all of the analyses I do in the next week. I will let you know if I feel more informed after that.
Is there a CV on R studio ???
?? R Studio is a user interface to R. If you mean "is there an R function to compute the coefficient of variation," then the answer is yes. There are probably several packages that include the CV, but an internet search includes the 'raster' package.
Pingback: Compute the geometric mean, geometric standard deviation, and geometric CV in SAS - The DO Loop
Can the coefficient of variation use in non-parametric distribution? In other words, is the coefficient of variation dependent on normal distribution ?
The coefficient of variation is simply the ratio σ/μ, so it is defined for any distribution that has a well-defined non-zero mean.
Thanks for your reply.
DR Rick Wicklin,
how can i get the coefficient of variation from this code?
thanks
Code:
data Flow2;
input Box Genotype Microorganism Moisture Replicate Flowering;
cards;
1 1 1 1 1 17
2 1 1 1 2 18
3 1 1 1 3 15
4 2 1 1 1 52
5 2 1 1 2 58
6 2 1 1 3 64
You can post code and ask questions at the SAS Support Communities.
How do I find the distribution of coefficient of variation
Wikipedia gives the distribution of the CV statistic for normal data. For other data distributions, I suspect you would need to use simulation-based methods to estimate the distribution of the CV statistic.