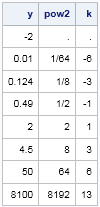
The other day I was doing some computations that caused me to wonder, "What is the smallest power of 2 that is greater than a given number?"
The mathematics is straightforward. Given a number n, find the least value of k such that
2k ≥ n
or, equivalently,
k ≥ log2(n).
It is easy to implement this formula in the SAS DATA step or in the SAS/IML language. The LOG2 function computes the base-2 logarithm of a number, and you can use the CEIL function to return the next-higher integer. With a little effort, you can even return a missing value if n is not a positive number. Here is a SAS/IML function that implements the formula:
proc iml;
start NextPow2(n);
   p = j(nrow(n), ncol(n), .);         /* allocate array to missing values */
   idx = loc(n>0);                     /* identify valid inputs */
   if ncol(idx)>0 then
      p[idx] = 2##ceil(log2(n[idx]));  /* apply formula to valid inputs */
   return( p );
finish;

/* test the function on valid and invalid data */
y = {-2 0.01 0.124 0.49 2 4.5 50 8100}`;
pow2 = NextPow2(y);  /* next greater power of 2 */
k = log2(pow2);      /* just get the exponent   */
print y pow2[format=FRACT.] k; |

Notice that the FRACTw.d format enables you to format decimals as fractions in SAS.
By changing the 2s to 10s, you can use the same algorithm (and the LOG10 function) to find the next power of 10.
However, if you want to find the next power of an arbitrary number b, then you need to use a little logarithm trick. If b is the base of a logarithm, then logb(x) = log10(x) / log10(b). Because of this identity, the LOG10 function is the only function you need to compute logarithms for any base! By using this handy mathematical identity, you can generalize the NextPow2 function and write a function that computes the next power of b, where b is any positive number.
The following SAS/IML function computes the next highest power of b for a given set of input values:
/* given n, compute the next highest power of b */
start NextPow(n, b);
   p = j(nrow(n), ncol(n), .);         /* allocate array to missing values */
   idx = loc(n>0);                     /* identify valid inputs */
   if ncol(idx)>0 then do;
      x = n[idx];
      p[idx] = b##ceil(log10(x)/log10(b));
   end;
   return( p );
finish;

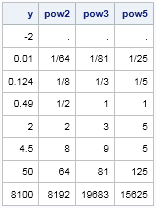
pow2 = NextPow(y,2);  /* next greater power of 2 */
pow3 = NextPow(y,3);  /* next greater power of 3 */
pow5 = NextPow(y,5);  /* next greater power of 5 */
print y pow2[format=FRACT.] pow3[format=FRACT.] pow5[format=FRACT.]; |

I think this TRICK is a real TREAT!

1 Comment
Pingback: The location of ticks in statistical graphics - The DO Loop