It's time for another blog post about ciphers. As I indicated in my previous blog post about substitution ciphers, the classical substitution cipher is no longer used to encrypt ultra-secret messages because the enciphered text is prone to a type of statistical attack known as frequency analysis.
At the root of frequency analysis is the fact that certain letters in English prose appear more frequently than other letters. In a simple substitution cipher, each letters is disguised by replacing it with some other symbol. However, a leopard cannot change its spots, and the frequencies of the symbols in an enciphered text can reveal which symbols correspond to certain letters. In a sufficiently long message, the symbols for common letters such as E, T, and A will appear often in the ciphertext, whereas the symbols for uncommon letters such as J, Q, and Z will occur rarely in the ciphertext.
The Wikipedia article on frequency analysis contains a nice example of how frequency analysis can be used to decrypt simple ciphers. This type of frequency analysis is usually one step in solving recreational puzzles, such the popular Cryptoquote puzzle that appears in many newspapers.
The frequency of letters in English text
The first task for a budding cryptanalyst is to determine the frequency distribution of letters in the language that he is deciphering. This is done by counting the number of times that each letter appears in a corpus: a large set of text (articles, books, web documents,...) that is representative of the written language. In today's world of digitized texts and rapid computing, it is easier than ever to compute the distribution of letters in a large corpus. This was done recently by Peter Norvig who used Google's digitized library as a corpus. I highly recommend Norvig's fascinating presentation of the frequency distribution of letters, words, and N-grams.
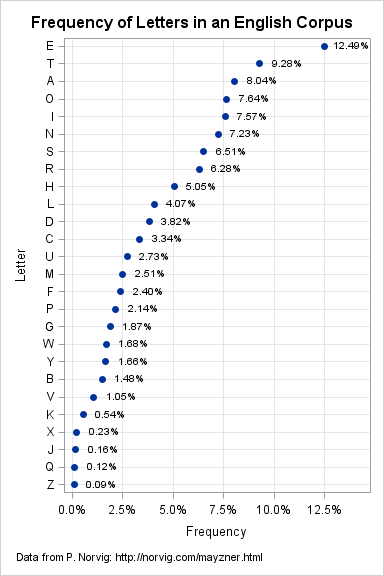
Since Norvig did the hard work, it is simple to enter the relative frequencies of each letter into SAS and visualize the results, as follows:
/* frequency of letters in English corpus (from Google digital library) */ data Letters; length Letter $1; informat Prop PERCENT8.; input Letter $ Prop @@; datalines; E 12.49% T 9.28% A 8.04% O 7.64% I 7.57% N 7.23% S 6.51% R 6.28% H 5.05% L 4.07% D 3.82% C 3.34% U 2.73% M 2.51% F 2.40% P 2.14% G 1.87% W 1.68% Y 1.66% B 1.48% V 1.05% K 0.54% X 0.23% J 0.16% Q 0.12% Z 0.09% ; title "Frequency of Letters in an English Corpus"; footnote H=8pt J=L "Data from P. Norvig: http://norvig.com/mayzner.html"; ods graphics / height=900 width=600; proc sgplot data=Letters; format Prop percent8.2; xaxis grid label="Frequency" offsetmax=0.15; yaxis grid discreteorder=data reverse; scatter y=Letter x=Prop / datalabel=Prop datalabelpos=right markerattrs=(symbol=CircleFilled); run; title; footnote; |

The graph shows that the letter E is the most common letter in the English language (12.5%), followed by T and A (9.3% and 8.0%, respectively). After the Big Three, the letters O, I, and N appear with similar frequencies. The letters S and R round out the list of the most frequent letters.
At the other end of the list, we see that X, J, Q, and Z are the least common letters in the corpus.
Although a simple substitution cipher can disguise the letters, it does not disguise the frequencies. Read on to see how this fact helps a cryptanalyst decipher messages that use a simple substitution cipher.
The distribution of letters in a short text
Suppose that I try to send a secret message by using a simple substitution cipher. In case the message is intercepted, I strip out all blanks and punctuation to make the ciphertext even harder to decipher. Here is the ciphertext presented as an array of long character string in SAS/IML:
proc iml;
msg ={"JWUAHDOHVJWBICHHKBIJHFEHQBSUJBFIJUZWPBTYUIDPSUXDLFOUIVHEUVVBZB",
      "UPJONIBLYODJBPASDJDBPIDIIHVJRDEUSDJDIBLYODJBHPBIDVYPSDLUPJDOJ",
      "UZWPBTYUBPIJDJBIJBZDOFEHAEDLLBPADPSEUIUDEZWJHUQDOYDJUIJDJBIJBZ",
      "DOLUJWHSINHYHVJUPPUUSJHZEUDJUSDJDRBJWKPHRPFEHFUEJBUICHJWEDPSHL",
      "DPSPHPEDPSHLJWBICHHKZHPJDBPILHEUJWDPHPUWYPSEUSDPPHJDJUSFEHAEDL",
      "IJWDJIBLYODJUSDJDRBJWIFUZBVBUSZWDEDZJUEBIJBZINHYZDPYIUIBLYODJU",
      "SSDJDJHUIJBLDJUJWUFEHCDCBOBJNHVDPUQUPJJHUIJBLDJUJWUIDLFOBPASBI",
      "JEBCYJBHPHVDIJDJBIJBZJHUIJBLDJUJWUZHQUEDAUFEHCDCBOBJBUIHVZHPVB",
      "SUPZUBPJUEQDOIDPSJHUQDOYDJUJWUEHCYIJPUIIHVDIJDJBIJBZDOJUIJIHLU",
      "FEHAEDLIDEUFEUIUPJUSBPJRHVHELIVBEIJYIBPAJWUSDJDIJUFDPSJWUPDADB",
      "PYIBPAJWUIDIBLOODPAYDAUCNFEUIUPJBPAJWUIDLUDOAHEBJWLBPJRHSBVVUE",
      "UPJRDNIJWUPHQBZUIDIBLOFEHAEDLLUEZDPOUDEPWHRJHREBJUIBLYODJBHPIB",
      "PJWUIDIBLOODPAYDAUODJUEZWDFJUEIJWDJSBIZYIILYOJBQDEBDJUIBLYODJB",
      "HPYIUJWUIDIBLOODPAYDAUWUDQBONBVNHYDEUIUEBHYIDCHYJIBLYODJBHPNHY",
"IWHYOSBPQUIJJWUJBLUJHOUDEPWHRJHYIUJWUIDIBLOODPAYDAUUVVBZBUPJON"}; |
The message looks formidable, but it isn't secure. Statistics—in the form of frequency analysis—can be used to suggest possible values for the letters in the text that occur most often. The following SAS/IML function counts the number of appearances of each letter in the string. It uses the SUBSTR function to convert the string into a SAS/IML vector, and then uses the LOC function to count the number of elements in the vector that matches each letter. The function returns a 26-element array whose first element is the proportion of the string that matches 'A', whose second element is the proportion that matches 'B', and so on:
start FreqLetters(_msg);
   msg = upcase(rowcat( shape(_msg,1) )); /* create one long string */
   m = substr(msg,1:nleng(msg),1);        /* break into array */
   letters = "A":"Z";
   freq = j(1,ncol(letters),0);
   do i = 1 to ncol(letters);
      freq[i] = ncol(loc(m=letters[i]));
   end;
   return(freq / sum(freq));   /* standardize as proportion */
finish;

p = FreqLetters(msg); /* proportion of A, B, C, ..., Z in message */ |
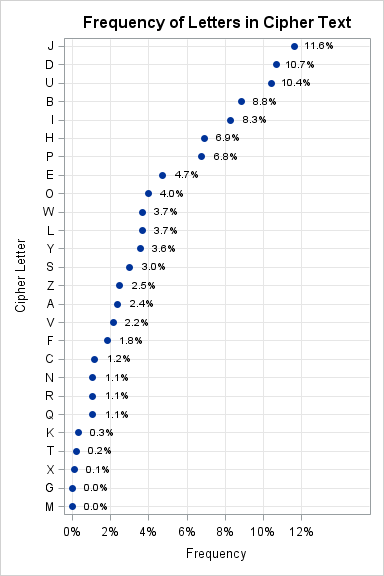
You can print out the raw numbers, but it is easier to visualize the proportions if you sort the data and make a graph. The following SAS/IML statements create the same kind of graph that appeared earlier, but this time the frequencies are for this particular short encrypted text:
/* compute frequencies; sort in descending order */
call sortndx(ndx, p`, 1, 1);
pct = p[,ndx]; let = ("A":"Z")[,ndx];
print pct[c=let format=percent7.2];

title "Frequency of Letters in Cipher Text";
ods graphics / height=900 width=600;
call scatter(pct, let) grid={x} label="Frequency" datalabel=Pct
     option="datalabelpos=right markerattrs=(symbol=CircleFilled)"
     Other="format pct DataLabel PERCENT7.1;"+
           "yaxis grid discreteorder=data reverse "+
"label='Cipher Letter';"; |

First, notice that SAS/IML 12.3 enables you to create this ODS graph entirely within SAS/IML. Notice that the distribution of (enciphered) letters in the short message looks similar to the previous graph (the distribution of letters in a corpus). You can think of the ciphertext as a sample of English text. As such, the frequency of letters in the cipher text is expected to be close to (but not identical to) the frequency of letters in the corpus. The frequencies in the small sample suggest that the most common letter, plaintext 'e', is probably being disguised as the ciphertext 'J', 'D', or 'U'. Similarly, the plaintext 't' and 'a' are probably disguised as 'J', 'D', or 'U', although they could also be 'B' or 'I'.
The reason frequency analysis is successful is not because it identifies certain letters with certainty—it doesn't! However, it indicates the probable identities of certain letters, and this greatly simplifies the number of possibilities that the cryptanalysts needs to check.
Using frequency analysis as a method of cryptanalysis
For the purpose of solving a recreational puzzle such as the Cryptoquote, this kind of single-letter frequency analysis is often sufficienct to begin breaking the code. The puzzle solver uses the frequency analysis to guess one or two of the substitutions (perhaps 'J'='e' and 'D'='t'). If the message still looks like gibberish after the guess, the guess was probably wrong, and the puzzler can make a different guess (perhaps 'J'='t' and 'U'='e'). Usually only a few steps of this guessing game are necessary until a substitution results in a partially deciphered text that looks like it might contain recognizable words. Then, like pulling a string on a sweater, the puzzle unravels as the puzzler uses existing knowledge to guide subsequent substitutions.
However, sometimes a single-letter frequency analysis is only the first step in attacking a cipher. A more sophisticated attack relies not only on the distribution of single letters, but also the frequency distribution of bigrams—pairs of adjacent letters that appear together. In my next blog post about ciphers, I will discuss bigrams and visualize the distribution of bigrams in SAS.

6 Comments
Nice series. Looking at the frequency analysis reminds me of the old-school Wheel Of Fortune bonus round where contestants could pick 5 consonants and 1 vowel. And they almost always picked R-S-T-L-N-E. So maybe a game show strategy question would be whether L is really a better guess than H (in the sense of being more helpful to solving the puzzle), even though H occurs more often than L. There are some great articles about using analysis to beat game shows, particularly stories about the guy who beat the "press-your-luck" non-random generator: http://en.wikipedia.org/wiki/Michael_Larson.
Interesting as the morse code was designed for most used letters to their shortest code. There is some variation by time, location group and possible more.
http://en.wikipedia.org/wiki/Morse_code
An other possible useful one is http://en.wikipedia.org/wiki/Benford's_law
Consider the values attached to letters in Scrabble (and frequencies):
1 point: E ×12, A ×9, I ×9, O ×8, N ×6, R ×6, T ×6, L ×4, S ×4, U ×4
2 points: D ×4, G ×3
3 points: B ×2, C ×2, M ×2, P ×2
4 points: F ×2, H ×2, V ×2, W ×2, Y ×2
5 points: K ×1
8 points: J ×1, X ×1
10 points: Q ×1, Z ×1
Pretty close, rank-wise, to the ordering in the graph above on English corpus letters.
I'm not sure how the Scrabble values/frequencies were derived originally - I guess I should look it up.
I'm glad you mentioned this! The value of a Scrabble tile was chosen to reflect how common/rare the letter is in English usage. However, in Scrabble you can make any word in a dictionary, whereas the corpus frequencies reflect how words are actually used in written text. For example, T, H, and E get used a lot in written English because the word 'the' is very common. Thus the distribution of letters in a dictionary (where every word appears once) is different from the distribution in a corpus (where common words are repeated many times).
Pingback: How to use frequency analysis to crack the Cryptoquote puzzle - The DO Loop
In Scrabble the words must intersect, and the scoring system encourages intersections with high values tiles, so the ideal tile distribution may be different from the letters in a dictionary. I notice from the above that the E to H ratio is about 5:2 in the English corpus, but 12:2 in terms of Scrabble tiles (see Mike C's frequencies above), which seems like a big disparity. It would be interesting to know the ratio for the dictionary distribution.