As you develop a program in the SAS/IML language, it is often useful to create graphs to visualize intermediate results. The language supports basic statistical graphics such as bar charts, histograms, scatter plots, and so on. However, you can create more advanced graphics without leaving PROC IML by using the SUBMIT and ENDSUBMIT statements to call the SGPLOT procedure. (Recall that you can call SAS procedures from the SAS/IML language.)
To give an example, suppose that you recently read my blog post about the RANDFUN function and you decide to try it out. You call the RANDFUN function to simulate 1,000 observations from a normal distribution with mean 10 and standard deviation 2. Because you have never used that function before, you might want to create a histogram of the simulated data to make sure that it appears to be correct. No problem: just use the CREATE statement to create a SAS data set from a SAS/IML matrix, then use the SUBMIT/ENDSUBMIT statements to call PROC SGPLOT:
proc iml;
call randseed(1);
x = randfun(1000, "Normal", 10, 2);          /* X ~ N(10,2) */

/* graph the simulated data */
create Normal var {x}; append; close Normal; /* write data */
submit;
  proc sgplot data=Normal;
    histogram x;                             /* histogram */
    density x / type=normal(mu=10 sigma=2);  /* overlay normal */
  run;
endsubmit; |
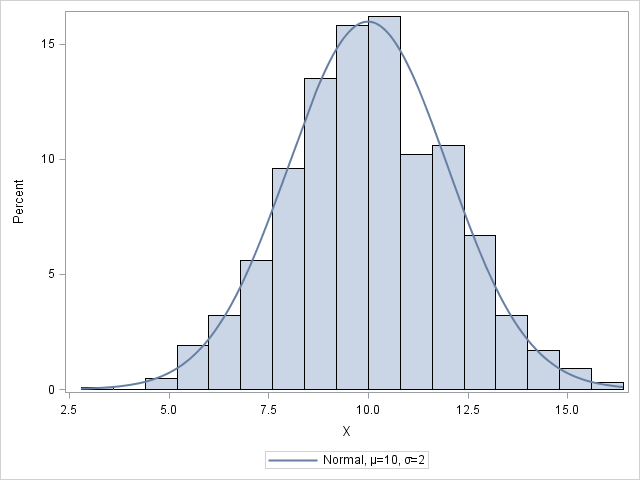
The graph overlays a normal density curve on a histogram of the data. The graph indicates that the data are normally distributed with the specified parameters.
This technique is very powerful: from within your SAS/IML program, you can create any graph by calling PROC SGPLOT or some other SG procedure!
In fact, you can do even more. You can write a module that encapsulates the creation of the data set and the call to PROC SGPLOT. The module can support optional parameters that invoke various options for PROC SGPLOT. For example, when called with one argument the following module displays a histogram. If you specify the optional second parameter, you can overlay a kernel density estimate on the histogram, as shown below:
/* call PROC SGPLOT to create a histogram; optionally overlay a KDE */
start MakeHistogram(x, addKernel=0);
   create _Temp var {x}; append; close _Temp; /* write data */
   densityStmt = choose(addKernel=0,  " ",  "density x / type=kernel");
   submit densityStmt;
     proc sgplot data=_Temp;
       histogram x;      /* create histogram */
       &densityStmt;     /* optionally add kernel density */
     run;
   endsubmit;
   call delete("_Temp"); /* delete temp data set */
finish;

run MakeHistogram(x);              /* just create a histogram         */
run MakeHistogram(x) addKernel=1; /* overlay kernel density estimate */ |
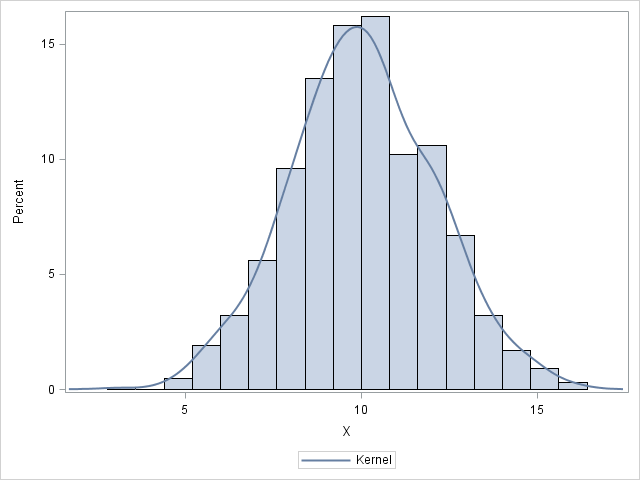
The histogram with the kernel density estimate is shown above. The module uses an optional parameter with a default value to determine whether to overlay the kernel density estimate. Notice that the variable densityStmt is a character matrix that is either blank or contains a valid DENSITY statement for the SGPLOT procedure. The densityStmt variable is listed on the SUBMIT statement, which is the way to pass a string value to a SAS procedure. Inside the SUBMIT block, the token &densityStmt resolves to either a blank string or to a valid DENSITY statement. Notice that the temporary data set (_Temp) is created and deleted within the module.
This article shows how you can write a module to create any graph of data in SAS/IML vectors by calling the SGPLOT procedure. The possibilities are endless. Do you have ideas about how you might use this technique in your own work? Leave a comment.

3 Comments
Pingback: Create standard statistical graphs from SAS/IML - The DO Loop
This looks really good Rick! Is it possible to use sgpannel in the same way? I am trying to obtain multiple histograms, similar to what the matlab function subplot would give me.
Yes. You can call any licensed SAS procedure from your IML program.