Each year my siblings choose names for a Christmas gift exchange. It is not unusual for a sibling to pick her own name, whereupon the name is replaced into the hat and a new name is drawn. In fact, that "glitch" in the drawing process was a motivation for me to write a program that automates the Christmas gift exchange because my program ensure that no sibling gives to himself or to his spouse.
Last week I got an email from a reader whose wife had pulled her own name while participating in a Secret Santa gift exchange. There were 10 names in the hat, and the reader wanted to know the probability of someone pulling her own name. He wrote a SAS/IML simulation program that estimated the probability for various group sizes. His simulation indicated that for six or more people, there is only a 36.8% chance that no person pulls her own name. (Equivalently, someone needs to redraw 63.2% of the time.) What was surprising is that for moderate-sized groups, the probability is independent of the size of the group!
The reader wondered whether I could explain this strange number (0.368) and why the probability is independent of the group size.
Permutations to the rescue
I was intrigued. Mathematically, pulling names from a hat is equivalent to a permutations of the numbers 1–n. There are two kinds of permutations. A "bad" permutation is one in which a number appears in its original position. (That is, a person draws her own name.) A "good" permutation has no number in its original position. The following SAS/IML statements generate three random permutations of the numbers 1–10. The first permutation is "bad" because the number 4 is in the 4th position and the number 7 is in the 7th position. The second permutation (not shown) is also bad. The third permutation is good because no number is in its original position.
proc iml; call randseed(1); do i = 1 to 3; perm = ranperm(10); print perm; end; |


Complete permutations
A permutations such that no number appears in its original position is called a complete permutation or a derangement. For small sets, you can use the ALLPERM function in SAS/IML to generate all permutations. You can then count how many permutations are complete and print the proportion of derangement. The following program is a modification of the reader's program:
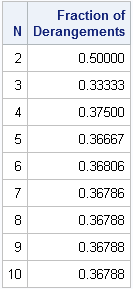
N = T(2:10); /* size of group: 2--10 */ f = j(nrow(N),1); /* proportion for which person picks own name */ do i = 1 to nrow(N); /* for each group size */ p = allperm(N[i]); /* get all permutations */ nperms = nrow(p); ident = repeat(1:N[i], nperms); /* repeat 1,2,...,N for each row */ cnt = (p=ident)[,+]; /* count numbers in orig position */ f[i] = sum(cnt=0) / nperms; /* proportion of derangements */ end; print N f[L="Fraction of Derangements" f=7.5]; |

Counting derangements
As you can see, the proportion of derangements ("good draws") converges very quickly to 0.368. For a group of size six or more, this means that 63.2% of the time, someone will pull her own name (a bad draw).
It turns out that mathematicians have figured out how to count the number of derangements. Just as the number of permutations is called the factorial, the number of derangements is called the subfactorial. You can show that the number of derangements on n objects is given by [n! / e], where n! is the number of permutations, e ≈ 2.71828... is the base of the natural logarithm, and [⋅] is the nearest integer. In other words, the following SAS/IML function counts the number of complete permutations on n elements:start Subfactorial(n);
return( round(fact(n)/exp(1)) );
finish;
N=2:10;
s = Subfactorial(n);
print (N//s)[r={"n" "Subfactorial(n)"}]; |

By looking at the formula, you can see that the ratio of the number of derangements to the number of total permutations converges to 1/e ≈ 0.3678..., which explains the number that was computed by the earlier SAS/IML program.
So there you have it. If n ≥ 6 people randomly draw names out of a hat, there is approximately a 63.2% chance of someone pulling her own name. What is surprising is that this probability does not depend on the size of the group. Whether the group is six people or sixty people, the probability that someone draws her own name is approximately the same!

5 Comments
The expected number of people who pull their own names turns out to be exactly 1, independent of the number of people. You can see this value by computing the following expression inside the loop:
e[i] = sum(cnt) / nperms;
For a nice derivation of this expected value, consider that each person pulls his or her own name with probability 1/N.
A related question: what is the probability that exactly N - 1 people pull their own names?
To illustrate what Rob said, consider the case of N=2. Either no one pulls her own name or both do. Thus the expected number of people who pull their own name is 1, even though the probability that someone (one or more people) pulls her own name is 0.5.
The probability that exactly N-1 people pull their own name is zero, right? If N-1 pull their own name, so does the Nth person.
Yes, zero is the correct probability. That idea is the source of a lame joke I make about being able to solve only five sides of Rubik's cube.
:-)
Very well explained and easy to understand. However, I am still struggling a bit with an extension of this. If there are, let's say n names in the hat. What is the probability that p people draw their own name, and how would you calculate this? Thanks for your help.