Last week I discussed a program that had three nested loops that used scalar operations in the innermost loop. I mentioned that this program was not vectorized, and would therefore be slow in a matrix language such as SAS/IML, MATLAB, or R. I then went through a series of steps in which I rewrote the program to be more efficient by using basic linear algebra operations such as dot products (level-1 BLAS), matrix-vector multiplication (level-2 BLAS), and matrix-matrix multiplication (level-3 BLAS). At each step, the number of loops decreases, and the efficiency increases.
Someone asked me what kind of speed-ups can be expected by vectorizing a SAS/IML program. In general, the answer depends on the size of your data and the particular operations that you are performing, but it is straightforward to run a series of examples that compare the performance at each step of the vectorization of the previous example.
In this post, I generate a square matrix of size N for N=100, 200, 400, 600, 800, and 1000. For each size, I time how long it takes to compute an operation that is equivalent to X`*X. The operations are as follows:
- Level-0: The original program, which consists of three nested loops and scalar operations.
- Level-1: A program that contains two nested loops and dot products of vectors.
- Level-2: A program that contains one loops and matrix-vector multiplication.
- Level-3: A program that contains one matrix-matrix multiplication.
You can download the program that performs the experiment.
On my desktop computer, the results are summarized by the following plots. The first plot shows all of the times. However, the graph is dominated by the slow times that are associated with the original program that had three nested loops and only scalar operations. The middle plot omits the times for the original program. In this view you can see that the level-1 operation is about 25 times faster than the level-0 operations for N=1000. Again, however, the graph is dominated by the slowest method, and so the last plot shows only the timings for the level-2 and level-3 operations. The level-2 operations are about 16 times faster than the level-3 operations for N=1000. The level-3 operations are almost three times faster than level-2.
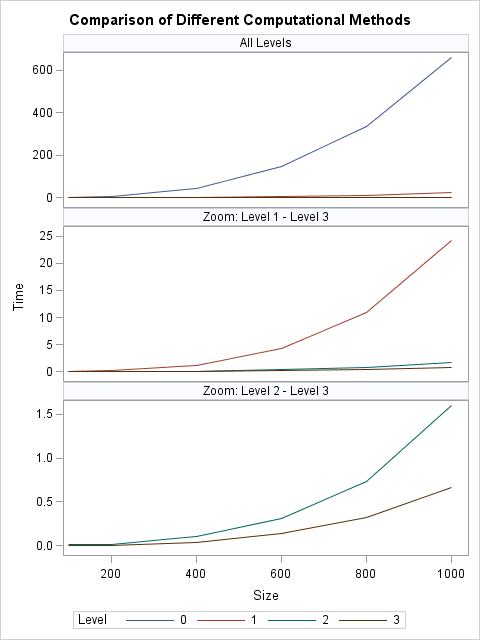
In summary, the slowest method (scalar operations in three nested loops) is about 1,000 times slower than the equivalent level-3 operation, which does not require any loops. This is good motivation: the time you invest to fully vectorize your code can pay dividends by running 1,000 times faster.
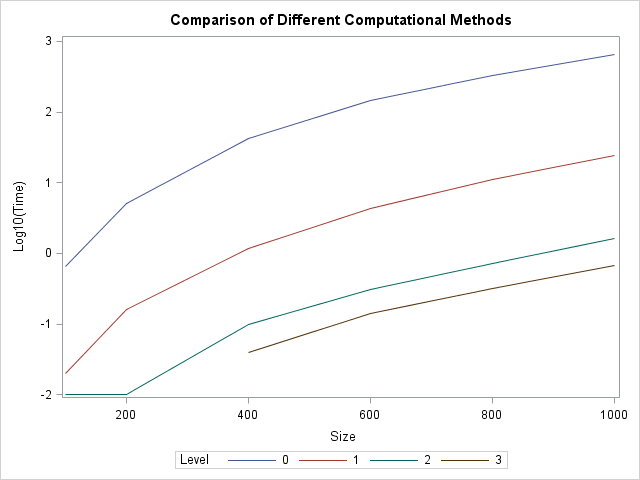
If you are adept at interpreting logarithmic scales, you can also see the results plotted on a Log10 axis.
No matter how you visualize the results, the conclusion is the same: if you want your program to scale to handle large data, vectorize the program to take advantage of the SAS/IML matrix operations.

2 Comments
Pingback: Resampling and permutation tests in SAS - The DO Loop
Pingback: Ten tips before you run an optimization - The DO Loop