A comment to last week's article on "How to get data values out of ODS graphics" indicated that the technique would be useful for changing the title on an ODS graph "without messing around with GTL."
You can certainly use the technique for that purpose, but if you want to make only a minor change to a graph, such as changing a title, then remember that the ODS Graphics Editor is even simpler. This article briefly reviews how to use the graphics editor. For more details, see the ODS Graphics Editor section of the SAS/STAT documentation.
Editing an ODS graphic is as easy as 1-2-3:
- Use the SGE=ON option to enable ODS to create editable graphics.
- Run the SAS procedure that creates the graph.
- Open the graph in the Graphics editor and modify it.
Step 1: Enable editable graphics
To enable the creation of editable graphics, use the SGE=ON option on the ODS statement. If you are using the HTML destination, use the following statement:
ods html sge=on; |
The previous statement instructs ODS to create an editable version of every graph. ODS continues to create the "regular versions," which are not editable, that are visible in the HTML or LISTING destinations. Creating editable graphs requires additional time, memory, and disk space, so use the SGE=OFF option when you are finished creating the graph.
Step 2: Create the editable graph
This example shows how to change the title and highlight several observations in a graph that is produced by the LOESS procedure. The following statements create the graph:
proc loess data=Sashelp.Cars plots(only)=fit; model mpg_city = horsepower / smooth=0.3; run; ods html sge=off; /* turn off the creation of editable graphs */ |
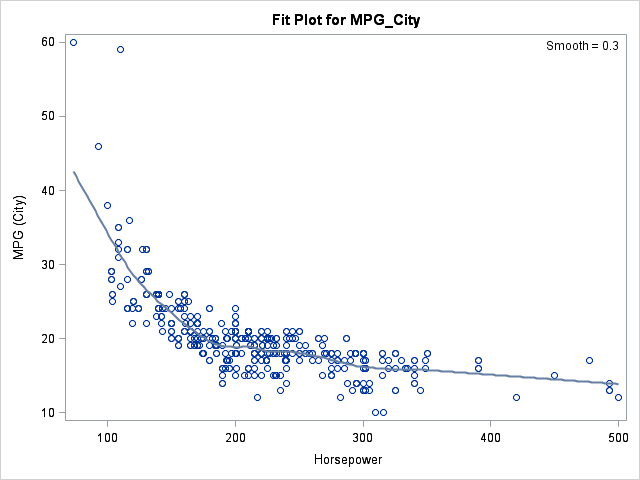
Suppose that you want to change the title of the graph and call attention to the fact that the three observations in the upper left portion of the plot are hybrid electric vehicles, which have low horsepower and high fuel efficiency. The ODS Graphics Editor provides a simple way to make these minor changes.
Step 3: Modify the graph
In the SAS Results window, navigate to the entry for the graph that you want to edit. There will be at least two entries: one for each ODS destination and one for the editable graph.
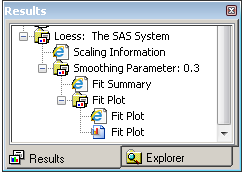
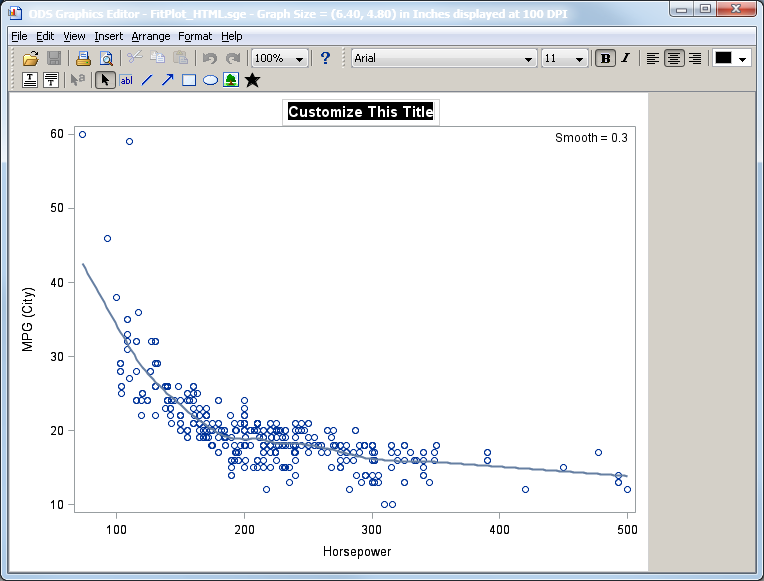
Right click on the last entry, which is the editable graph, and select Open from the pop-up menu. The graph opens in the ODS Graphics Editor. Click on the title and type in a new one.
You can make other changes as well. For example, in the following image I have added arrows and a text box to highlight the three hybrid electric vehicles in the graph.
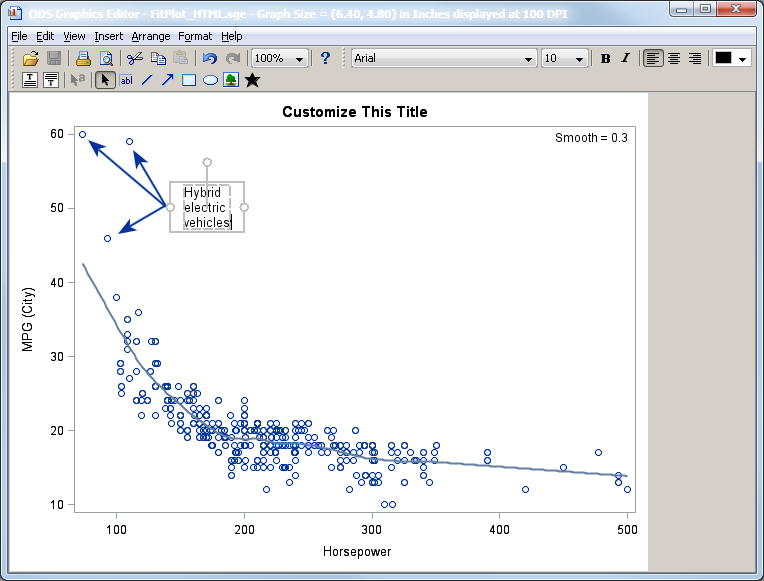
You can now save the graph as a PNG file.
Notice that the edited image does not replace the original image. It is an additional image that you can include in a report or send to a colleague.

4 Comments
With SAS 9.3, you can render a saved SGE file to any open ODS destination by using the SGRENDER procedure. Use the SGE= fileref | “file-name” option. The graph with the customizations and annotations will be rendered to the open destinations. The output is scalable for the appropriate destination and format. See SAS documentations for the SGRENDER procedure for more details.
So this is good for one-offs, right? Which works pretty well in an exploratory fashion, or for a presentation where you may not need to generate the graph again. But for graphs that require regenerating over and over, would we still need to extract the data using the previous tip or editing the underlying GTL?
Correct. If you want a plot to ALWAYS be customized, edit the GTL. This is a simple cosmetic touch-up after the plot is produced by the default methods. Great for slideshows, presentations, and blogs.
Pingback: Top blog comments last week - SAS Voices