Many SAS procedures can produce ODS statistical graphics as naturally as they produce tables. Did you know that it is possible to obtain the numbers underlying an ODS statistical graph? This post shows how.
Suppose that a SAS procedure creates a graph that displays a curve and that you want the (x,y) values along the curve. Or maybe the procedure creates a scatter plot and you want the data values for each marker. Often you can scour the SAS documentation until you find some option that produces the values that you want, either in a table or in an output data set. But occasionally I've been stymied. "SAS computed the values," I've hissed through clenched teeth, "why won't it let me see them!"
Another reason to want the data in a graph is if the ODS graph isn't quite what you want. Maybe the SAS procedure creates a histogram but you prefer a box plot. Maybe you just want to make minor modifications to the graph's appearance. If you can get the data, you can use PROC SGPLOT to redraw the graph the way that you want it.
So how can you get the values that underlie an ODS statistical graph? The key observation is that every graph is an ODS "object" that has a name. Therefore you can use the ODS OUTPUT statement to write the data in the ODS object to a SAS data set.
Getting to the data in a Q-Q Plot
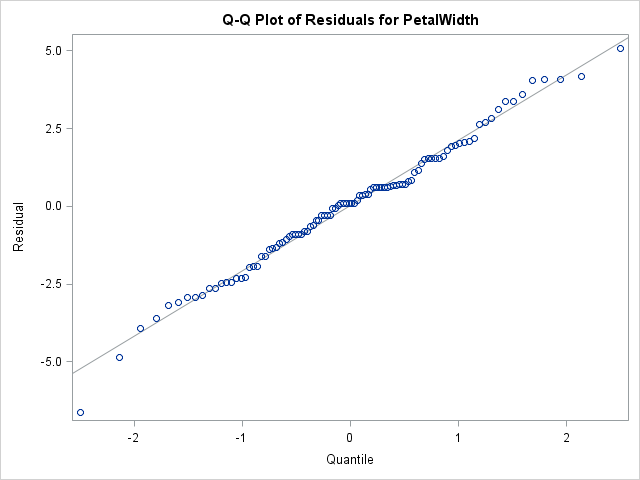
As an example, suppose that you run a regression that the procedure outputs a normal quantile-quantile (Q-Q) plot of the residuals. Suppose further the you want to obtain the data used to create the plot.
You can use the ODS TRACE ON statement to find out the name of any ODS object (including a graph) that is produced by a procedure. In the following statement, PROC LOESS fits a curve to a subset of data in the Sashelp.Iris data set and creates several graphs, including a Q-Q plot with the name "QQPlot." You can use the ODS OUTPUT statement to create a SAS data set that contains the data in the Q-Q plot:
ods graphics on; proc loess data=sashelp.iris plots=QQPlot; where Species^="Setosa"; model PetalWidth = PetalLength; ods output QQPlot = QQData; /* create data set from QQPlot */ run; |

The Q-Q plot is shown above. Let's see what the QQData data set looks like:
proc contents data=QQData varnum; ods exclude Attributes EngineHost; run; |

The PROC CONTENTS output shows that QQData contains six variables. Several have long names and bizarre labels. The names of the variables are generated automatically by the procedure and are not intended for "human consumption." Nevertheless, this data set contains all the data necessary to reproduce the reproduce the figure. Well, almost. The equation of the line is not in the data, but you can use PROC UNIVARIATE to find out the parameter estimates for the normal curve that best fits the residuals. The analysis is not shown, but the parameter estimates are (Mean, StdDev) = (0.02, 2.10).
Creating a new graph of the same data
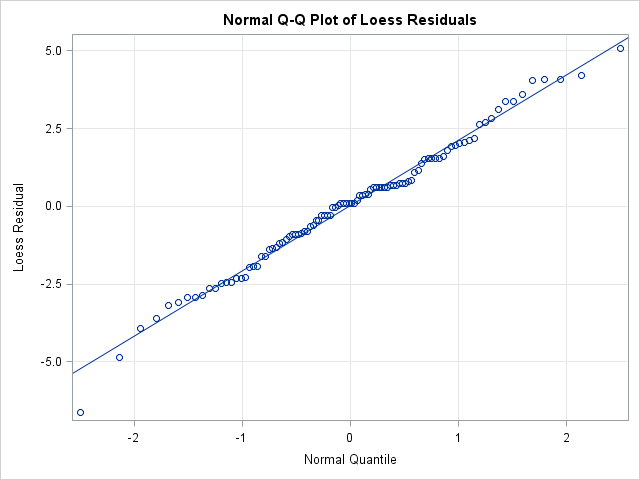
The hardest part of this process is figuring out the weird variable names. By looking at the graph and by knowing how Q-Q plots are created, you can determine the names of the X and Y variables. The following statements create a new Q-Q plot from the data that underlies the Q-Q plot of the loess residuals.
proc sgplot data=QQData noautolegend; title "Normal Q-Q Plot of Loess Residuals"; scatter x=PROBIT___NUMERATE_SORT_DROPMISSI y=SORT_DROPMISSING_RESIDUAL__; lineparm x=0 y=0.02 slope=2.10; /* intercept, slope */ xaxis grid label="Normal Quantile"; yaxis grid label="Loess Residual"; run; |

The LINEPARM statement draws the diagonal reference line in the Q-Q plot. Although the data are the same, the new plot has different labels, a grid, and a descriptive title. (Another way to change the appearance is to edit the GTL template or to use the ODS Graphics Editor.)
So next time you want to get the data in an ODS graph, remember that graphs are ODS objects and that you can use the ODS OUTPUT statement to the write the data to a data set. If you can make sense of the cryptic variable names, this technique provides the values that are associated with graphical elements. You can use the values in computations or to create a modified version of the graph.

11 Comments
That's a nice trick! Is there also a way to recover the code used to produce the original graph? I've used ods output quite a bit (never from graphs) and sometimes the data appear in a noticeably different format than the original output. I assume this is something you can find in the template? I've never played with that...
Yes! You can look at the underlying template. It is written in GTL and might be more complicated than you expect because it might handle more cases than you are interested in. I'm out of the office this week, but maybe I can write a blog post on how to find the template in the next week or two.
This trick is great! It can be very helpful.
Finally! Kaplan-Meier graphs with the titles that I want, and without messing around with GTL!
Pingback: Change a plot title by using the ODS Graphics Editor - The DO Loop
Pingback: How to create a hexagonal bin plot in SAS - The DO Loop
Hi, I got the data from the ods graph, but it is not in the precision I needed. For example the X axis goes from 0, 0.05, 0.1, 0.15, 0.20; but I really want it to be like from 0, 0.01, 0.02, 0.03 etc.
Any idea about that?
Many thanks
Hard to say with no information provided. Post your code to the SAS Graphing Support Community. To get a good answer, be suer to read this article.
Hi Rick,
Helpful post but I'm new to SAS and finding it hard to apply to my specific situation.
I have made a line graph with sgplot command, as shown below:
proc sgplot data=skin_renewal;
where group = "Paars";
title ‘renewal paars’;
vline StimID / response=SCR stat=mean group=Testdag limitstat=stderr limits=both groupdisplay=cluster;
run;
I would like to get the data out of the graph (the values as SAS computed). I tried ods output statement but it didn't work. I am not sure if this only works with simpler graphs than mine (Q-Q plots, for instance, as you showed above).
Is there anyway to get the data out from a line/bar graph that was made using proc sgplot?
Best,
Boushra
Welcome to SAS. You can post questions, data, example code, etc, as the SAS Support Community. This question is perfect for the Graphics Support Community. Be sure to specify what you mean by "didn't work." If you get an error, post the log. If you didn't get what you expected, then explain. Good luck!
Pingback: Nine ways to visualize a continuous univariate distribution in SAS - The DO Loop