Last week I blogged about how to construct a smoother for a time series for the temperature in Albany, NY from 1995 to March, 2012. I smoothed the data by "folding" the time series into a single "year" that contains repeated measurements for each day of the year.
Experts in time series analysis would use different techniques to analyze these data, so today I'm giving my colleague, Udo Sglavo, a chance to comment on how he might analyze these data. I am not knowledgeable about the Singular Spectrum Analysis method that he presents, but it seems like a powerful mixture of principal component analysis and orthogonal decomposition analysis in the time domain. Enjoy this guest post!
-- Rick

Rick’s blog about smoothers for periodic data caught my attention because I recently read a SAS Global Forum paper, "An Introduction to Singular Spectrum Analysis with SAS/ETS Software" by M. Leonard, et al. Singular spectrum analysis is a relatively new approach to modeling long time series data for which patterns (such as trends and cycles) are difficult to visualize and analyze. The general idea of singular spectrum analysis is to apply nonparametric techniques for decomposing time series data into principal components. Since the paper also used temperature data as an example, I thought it would be fun to apply singular spectrum analysis to the Albany temperature data.
It is good practice to visualize the data first, so I plotted the complete time series and the seasonal cycles using monthly temperature averages. You can plot the data by using the TIMESERIES procedure in SAS/ETS software:
proc timeseries data=tempdata out=_null_ plot=(series cycles); title "Average Temperature per Month"; id date interval=month accumulate=average; var temperature; run; |
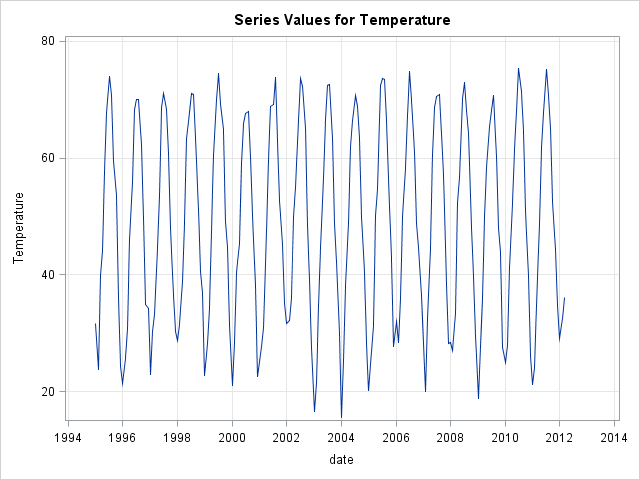
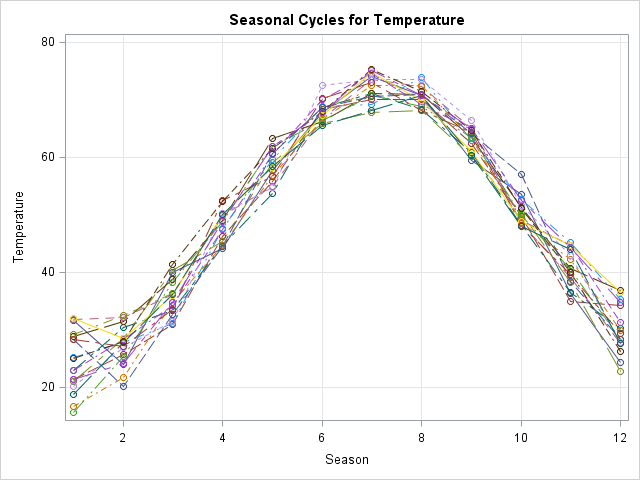
As expected the temperature data shows a strong seasonal behavior with high average temperatures in summer and low average temperatures in winter.
As a next step, I applied a singular spectrum analysis to decompose the data into two main components:
proc timeseries data=tempdata out=_null_ plot=SSA; title "SSA Analysis: Average Temperature per Month"; id date interval=month accumulate=average; SSA / LENGTH=12 GROUPS=(1)(2 3); var temperature; run; |
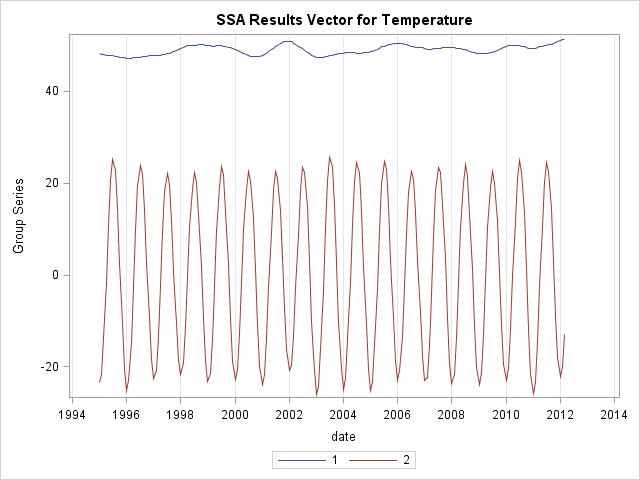
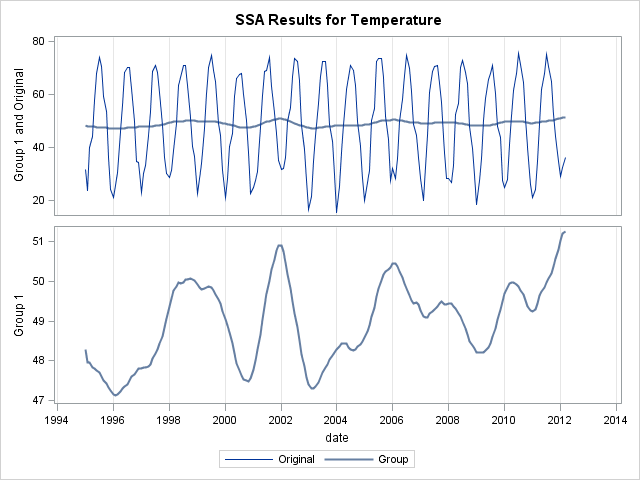
The first component (labeled 1) seems to reflect the long-term trend, whereas the second component (labeled 2) reflects the cyclic behavior of the temperatures. When overlaying individual components with the original series, this relationship becomes even more apparent. For example, the following plot shows that the first component looks like a moving average:
Other times series analysis techniques, such as seasonal decomposition, could also be used to analyze these data.
I could have decomposed the original series into more components to identify additional patterns in the data, as is shown in the paper "An Introduction to Singular Spectrum Analysis with SAS/ETS Software". See the documentation for the TIMESERIES procedure for further information about the singular spectrum analysis, how to identify the number of patterns in the data, and its implementation in SAS/ETS software.
In conclusion, my analysis suggests that even after removing seasonal effects of temperature from the data, the long-run average monthly temperature trend is not constant. The first SSA component goes up and down, which shows that additional factors affect the weather in Albany. The most recent Albany winter was one of the warmest since 1995, but the data also show other winters (such as 2002 and 2006) during which Albany experienced higher than average winter temperatures.

1 Comment
How can I use Singular Spectrum Analysis to detection change point for time serious of air temperature for the past several decades,thanks a lot1