Halloween night was rainy, so many fewer kids knocked on the door than usual. Consequently, I'm left with a big bucket of undistributed candy.
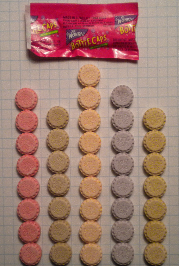
One evening as I treated myself to a mouthful of tooth decay, I chanced to open a package of Wonka® Bottle Caps. The package contained three little soda-flavored candies, and I was surprised to find that all three were the same flavor: grape. "Hey," I exclaimed to my youngest child, "they're all the same color! What do you think are the odds of that? You want to help me check some other packages?"
"Mom! Daddy's making me work on his blog," she complained.
After assuring her that she could devour the data when I finished my analysis, she helped me open the remaining packages of Bottle Caps and tabulate the flavors of the candies within.
The flavors of Bottle Caps candies are cola, root beer, grape, cherry, and orange. As we unwrapped the sugary data, my daughter and I hypothesized that the flavors of Bottle Caps were evenly distributed.
Although the hypothesis is the obvious one to make, it is not necessarily true for other candies. There have been dozens (hundreds?) of studies about the distribution of colors in M&M® candies. In fact, many math and statistics classes count the colors of M&M candies and compare the empirical counts to official percentages that are supplied by the manufacturer. The great thing about this classic project is that the colors of M&Ms are not uniformly distributed. Last time I checked, the official proportions were 30% brown, 20% yellow, 20% red, 10% orange, 10% green, and 10% blue.
So what about the Bottle Caps? There were 101 candies in 34 packages (one package contained only two candies). If our hypothesis is correct, the expected number of each flavor is 20.2 candies. We counted 23 Cherry, 15 Cola, 21 Grape, 25 Orange, and 17 Root Beer.
I entered the data into SAS for each package. (If you'd like to do further analysis, you can download the data.) Each package is a sample from a multinomial distribution, and I want to test whether the five flavors each have the same proportion, which is 1/5. I used the FREQ procedure to analyze the distribution of flavors and to run a chi-square test for equal proportions:
proc freq data=BottleCaps; label Flavor = "Flavor"; weight Count; tables Flavor / nocum chisq plots=DeviationPlot; run; |
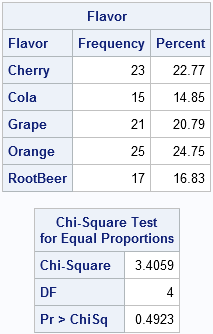
The chi-square test gives a large p-value, so there is no statistical indication that the proportions of flavors of Bottle Caps are not uniform. All of the deviations can be attributed to random sampling.
The FREQ procedure can automatically produce plots as part of the analysis. For these data, I asked for a bar chart that shows the relative deviations of the observed frequencies (O) from the expected frequencies (E). The relative deviation is part of the chi-square computation, and is computed as (O-E)/E.
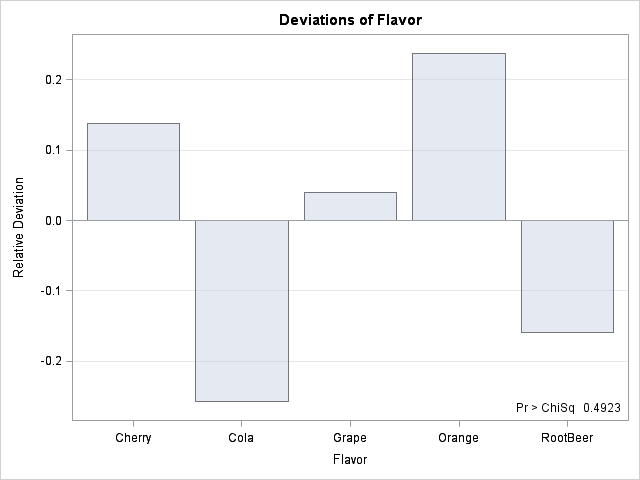
Although the Bottle Caps that I observed had fewer cola and root beer flavors than expected, the chi-square test shows that these deviations are not significant. Anyway, my favorite Bottle Caps are cherry and orange, so I think the sampling gods smiled on me during this experiment.
Conclusion? Looks like Wonka makes the same number of each flavor. Now back to my pile of sugary goodness. I wonder how many candies are in a typical box of Nerds...

2 Comments
Pingback: Square root transformations: How to handle negative data values? - The DO Loop
Nice analysis! My favorite is root beer flavored, which is unfortunately one of the lower percentages. :\