Exploring correlation between variables is an important part of exploratory data analysis. Before you start to model data, it is a good idea to visualize how variables related to one another. Zach Mayer, on his Modern Toolmaking blog, posted code that shows how to display and visualize correlations in R. This is such a useful task that I want to repeat it in SAS software.
Basic correlations and a scatter plot matrix
Mayer's used Fisher's iris data for his example, so I will, too. The following statement uses the CORR procedure to compute the correlation matrix and display a scatter plot matrix for the numerical variables in the data:
proc corr data=sashelp.iris plots=matrix(histogram); run; |
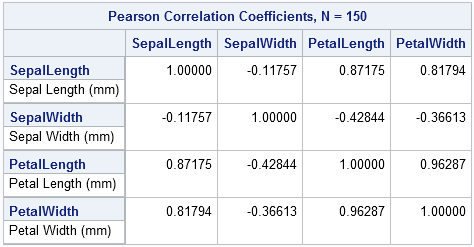

Notice that by omitting the VAR statement, the CORR procedure analyzes all numerical variables in the data set.
The PLOTS=MATRIX option displays a scatter plot matrix. In SAS 9.3, ODS graphics are turned on by default. (In SAS 9.2, you need to submit ODS graphics on; prior to the PROC CORR statement.) The result is a "quick-and-dirty" visualization of pairwise relationships and the distribution of each variable (along the diagonal). This is the beauty of ODS graphics: the procedures automatically create graphs that are appropriate for an analysis.
A fancier scatter plot matrix
Mayer also showed some fancier graphs. You can use the SGSCATTER procedure to re-plot the data, but with observations colored according to values of the Species variable, and with a kernel density estimate overlaid on the histogram.
proc sgscatter data=sashelp.iris; matrix SepalLength--PetalLength /group=Species diagonal=(histogram kernel); run; |
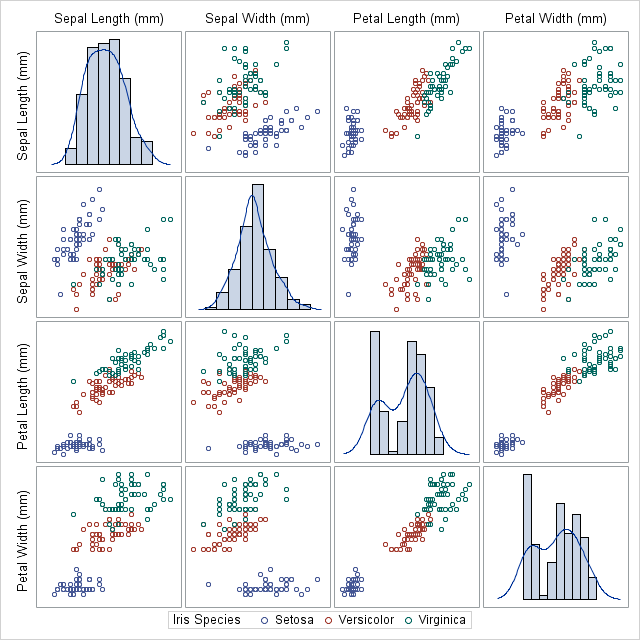
Notice how I specified the variables. Did you know that you can specify a range of consecutive variables by using a double-dash? This SAS syntax isn't widely known, but can be very useful.
More options, more details
I don't usually add smoothers to my scatter plot matrices because I think it gives the false impression that certain variables are response variables. I prefer to focus on correlation first and save modeling for later in the analysis. However, Mayer showed some loess smoothers on his plots, so I feel obligated to show SAS users how to produce similar displays.
The observant reader will have noticed that there are no scales or tick marks on the scatter plot matrices that I've shown so far. The reason is that axes and scales can distract from the primary goal of the exploratory analysis, which is to give an overview of the data and to see potential pairwise relationships. In Tufte's jargon, the scatter plot matrices that I've shown have a large data-to-ink ratio (Ch. 4, The Visual Display of Quantitative Information).
However, scatter plot matrices also can serve another purpose. During the modeling phase of data analysis they can serve as small multiples that enable you to quickly compare and contrast a sequence of related displays. In this context, scales, tick marks, and statistical smoothers are more relevant.
In general, you can use the SGPANEL procedure to display small multiples. However, I'll use the SGSCATTER procedure again to show how you can add more details to the display. Instead of using the MATRIX statement, I will use the PLOT statement to control exactly with pairs of variables I want to plot. If I think that PetalWidth variable explains the other variables, I can use the LOESS option to add a loess smoother to the scatter plots, as shown in the following example:
proc sgscatter data=sashelp.iris; plot (SepalLength SepalWidth PetalLength)*PetalWidth / group=Species loess rows=1 grid; run; |
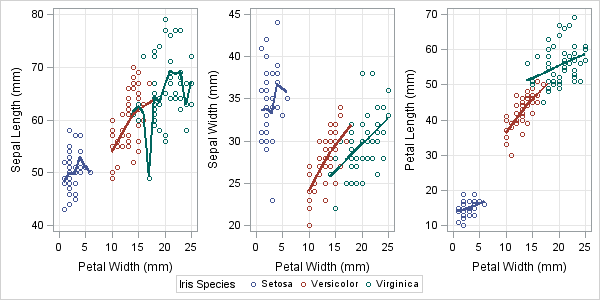
Notice that the loess smoothers are added for each group because the GROUP= option is specified. If, instead, you want to smooth the data regardless of the group variable, you can specify the LOESS=(NOGROUP) option, which produces smoothers similar to those shown by Mayer.
